It started with a number I did not expect to see in September. On Wednesday, September 2, 2026, MISO’s demand peaked at 123,718 MW. That is the figure from MISO’s real-time supply and demand feed, which publishes on a fifteen-minute grid, recorded at 5:00 PM ET. On the hourly zonal accounting it comes to 123,145.9 MW in the hour ending 6:00 PM ET. Both numbers are correct and they measure slightly different things, which is a theme of this post. MISO’s own post-event review gives a third, 122.9 GW, and calls it an all-time September peak, without saying which measure it used.
On the hourly series it was the third-highest peak of the summer, behind only June 29 and June 30, and the highest single day since June 30. That evening MISO declared an emergency, and the grid came within 204 MW of running out of committed supply.
I want to explain why that happened, because the interesting part is not that the grid got stressed on a hot day. It is that it took three things going wrong at once. Two of them I can see in my own archive, and I can show with the rest of the summer’s data that neither would have been enough on its own. The third I could not see at all until MISO published its own review of the evening on September 25 and walked its reliability stakeholders through it on September 29.
The vocabulary, quickly
MISO is the Midcontinent Independent System Operator, the organization that runs the wholesale electricity market and balances supply against demand across fifteen states and one Canadian province, including most of eastern Missouri, which is Ameren’s territory.
Committed capacity is the generation MISO has actually instructed to be running or ready to run in a given interval. Margin is committed capacity minus demand: the cushion. When margin goes to zero, something has to give.
EEA stands for Energy Emergency Alert. It is a term from NERC, the North American Electric Reliability Corporation, which sets and enforces reliability standards for the power grid across the United States, Canada and part of Mexico. It comes in three levels, which MISO declares as steps of a Maximum Generation Event. Step 1 means MISO is using generation it normally holds back. Step 2 opens up emergency actions, which can include buying emergency energy from neighbors and calling on customers who are contracted to cut demand. Step 3 is controlled load shedding, which is to say deliberate outages. September 2 reached Step 2.
MTLF is the Mid-Term Load Forecast, MISO’s own prediction of how much electricity the system will need. There are two forecast products carrying that name and telling them apart matters later.
MISO labels its timestamps EST all year. In September that runs one hour behind Eastern Daylight Time, so a MISO time stamped 18:44 is 7:44 PM ET. All times in this post are Eastern.
What happened, in order
The heat had been building since the weekend. MISO put its whole footprint under a Hot Weather Alert, Conservative Operations and a Capacity Advisory at 7:00 AM ET on Monday, August 31. On September 2 it posted a Hot Weather Alert notice at 2:11 PM ET and updated its Conservative Operations Declaration, a routine posture change, at 4:59 PM ET. None of that is unusual for a September heat wave. The system carried a comfortable cushion through the afternoon.
Demand peaked at 5:00 PM ET with 6,574 MW of margin still in hand. That is not a lot on a 123 GW system, but it is not an emergency either.
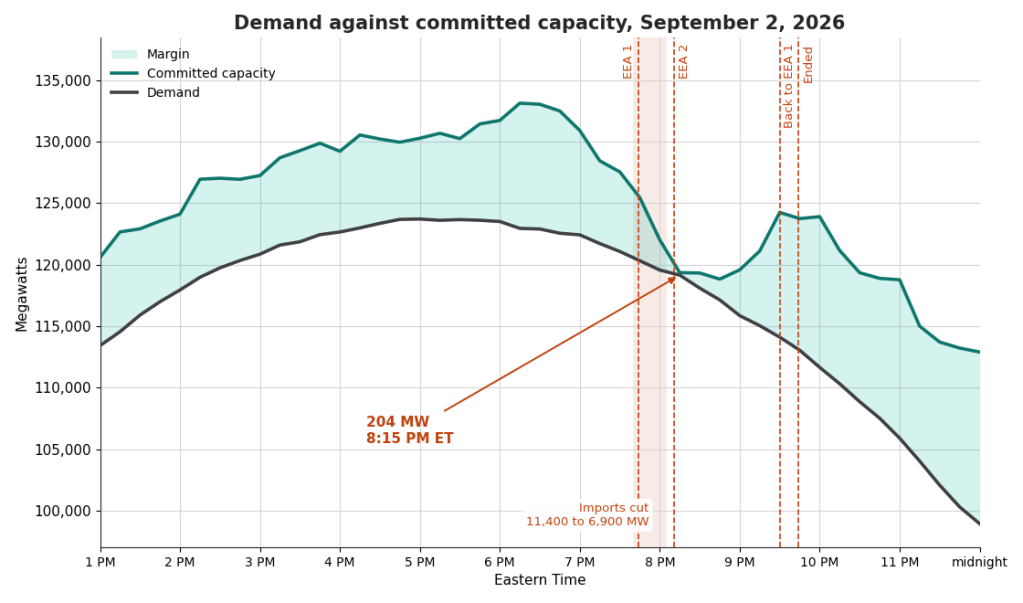
Committed capacity then kept climbing for more than an hour after demand had turned over, reaching 133,144 MW at 6:15 PM ET. That is why the cushion was wider at 6:30 PM ET than it had been at the peak. What happened next is that committed capacity fell 13,787 MW over the following two hours while demand fell only 3,805 MW.
- 6:30 PM ET: margin 10,147 MW
- 7:00 PM ET: margin 8,488 MW
- 7:30 PM ET: margin 6,476 MW
- 7:40 PM ET: MISO is importing 11,400 MW from its neighbors
- 7:44 PM ET: MISO declares a Maximum Generation Event Step 1 (EEA 1)
- 8:00 PM ET: margin 2,456 MW
- 8:05 PM ET: imports are down to 6,900 MW
- 8:07 PM ET: MISO deploys about 1,800 MW of its contingency reserves, the generation it holds ready to cover a sudden loss
- 8:11 PM ET: MISO escalates to Step 2 (EEA 2)
- 8:15 PM ET: margin 204 MW, the low point of the day, with demand at 119,153 MW
- 9:30 PM ET: MISO steps back down to Step 1
- 9:44 PM ET: the event is terminated
- 11:00 PM ET: by now every import curtailment has ended
Figure 1 shows the whole afternoon and evening. What you are looking at is the teal line, committed capacity, falling faster than the dark gray line, demand. Demand was already coming down from its peak. Committed capacity came down faster.
MISO’s review charts a different cushion. Its online reserve margin goes below zero at about 8:00 PM ET on MISO’s chart and stays there for about three quarters of an hour. The slide labels that chart as the North and Central regions, but MISO said at the September 29 meeting that the label is wrong and the line covers the whole system. My 204 MW is committed capacity minus demand across the whole footprint, read from the public feed. So the two cover the same territory, and the difference between them is what they measure. MISO has not defined its measure, but one named for reserves will not read the same as mine. Both are correct. On either one, the evening ran out of room.
The marginal energy cost, which is roughly the price of the next megawatt, touched $10,000 at 8:05 PM ET, the same minute MISO’s imports hit their low. That is MISO’s value of lost load, or VOLL, the price it puts on electricity that cannot be delivered, and it doubles as the ceiling on market prices. The Federal Energy Regulatory Commission, or FERC, which regulates wholesale electricity markets, approved raising it from $3,500 to $10,000 effective September 30, 2025, so the summer of 2026 is the first with a $10,000 ceiling. MISO’s review says the intervals where its fleet could not ramp fast enough were priced at exactly that ceiling. The daily mean was $578.
MISO’s own declaration named four causes: above normal temperatures, higher than forecasted load, loss of import interchange schedules, and transfer capabilities. MISO’s post-event review, posted on September 25 and presented on September 29, leads with the third and fourth. I take them in the order I found them: load, then forecast, then imports.
The first condition: a near-record load
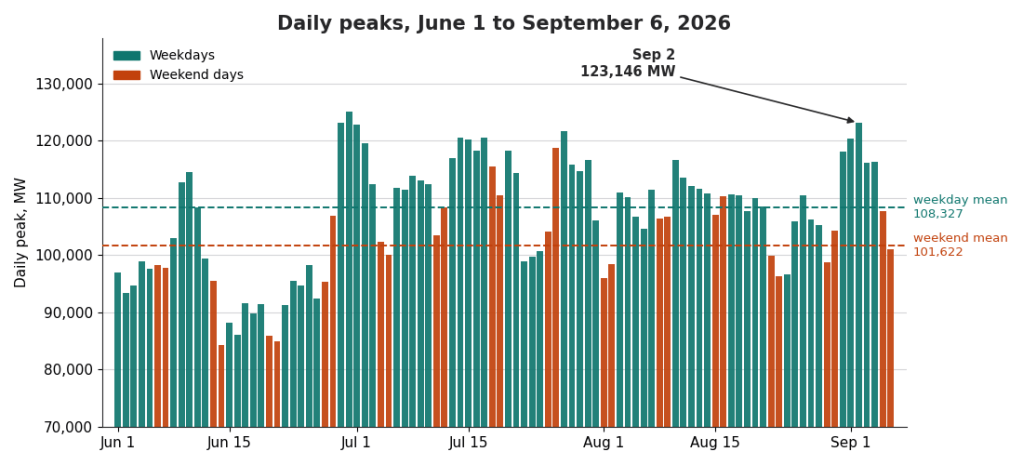
June 1 through September 6 gives 98 days of peaks. On the hourly zonal series, September 2 sits third, 1,927 MW below June 30 and 35 MW below June 29. On its own that is a hard day, not an emergency. June 30 carried a higher peak and June 29 carried a peak within 35 MW, and the summer absorbed both.
There is a second thing worth noticing about the date. September 2 was a Wednesday. Across the season the average weekday peak was 108,327 MW and the average weekend peak was 101,622 MW, a gap of 6,705 MW. The workday itself is worth about six and a half gigawatts. The heat wave broke over the following holiday weekend, with 107,774 MW on Saturday and 101,105 MW on Sunday, and the emergency did not repeat.
The second condition: the forecast was low
Every day, MISO publishes a day-ahead forecast: a full 24-hour load prediction produced the day before, which then stays fixed. For September 2 that forecast was built on September 1. At the hour when demand actually peaked, it was 3,590.9 MW below what happened.
That is the second-largest under-forecast of the summer out of 98 days. Only July 6 was worse, at 4,539.2 MW.
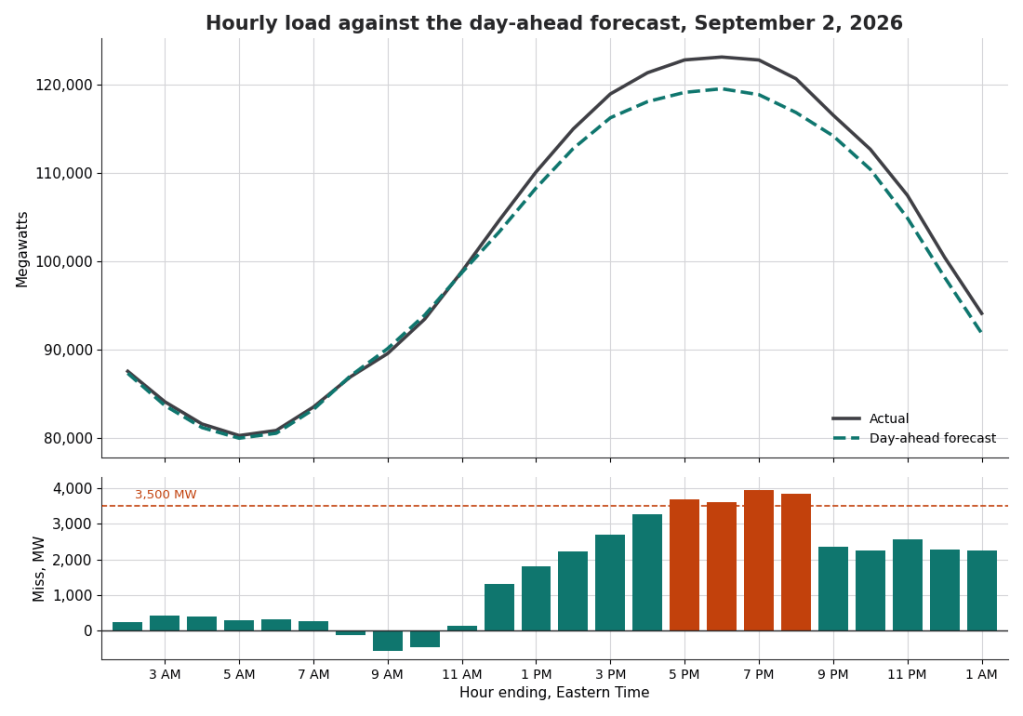
The miss was not confined to the peak hour. It opened up around the hour ending noon ET and stayed open through the last hour of the day, running above 3,500 MW for four consecutive hours across the late afternoon and evening. The largest single hour was the hour ending 7:00 PM ET at 3,928.6 MW.
It was also not spread evenly across the footprint. MISO divides its territory into Local Resource Zones, or LRZs, and in the hour ending 8:00 PM ET the forecast miss broke down like this:
- LRZ1 (Minnesota, the Dakotas, western Wisconsin): 1,526.0 MW
- LRZ6 (Indiana): 830.4 MW
- LRZ3_5 (Iowa, Missouri): 422.3 MW
- LRZ2_7 (Wisconsin, Michigan): 377.7 MW
- LRZ4 (central and southern Illinois): 354.2 MW
- LRZ8_9_10 (Arkansas, Louisiana, Mississippi, Texas): 316.6 MW
LRZ1 accounted for 40 percent of the miss while carrying 13.5 percent of the load. One zone in the north was substantially responsible for a shortfall that turned into a system-wide emergency.
Why neither of those alone explains it
This is the part I find most useful.
July 6 carried a larger day-ahead miss than September 2, 4,539.2 MW against 3,590.9 MW. It peaked at 111,776.2 MW, which is 11,369.7 MW below September 2. A big forecast error on a moderate day is absorbed by the supply that is already committed.
June 30 carried a higher peak than September 2, 125,073.4 MW against 123,145.9 MW. Its day-ahead forecast ran 1,782.6 MW above actual. A near-record day that MISO saw coming is a day MISO has already committed generation for.
Figure 4 puts all 98 days on one chart, peak against forecast miss. Above 120 GW and missed low by more than 3 GW, there is exactly one day in the corner.
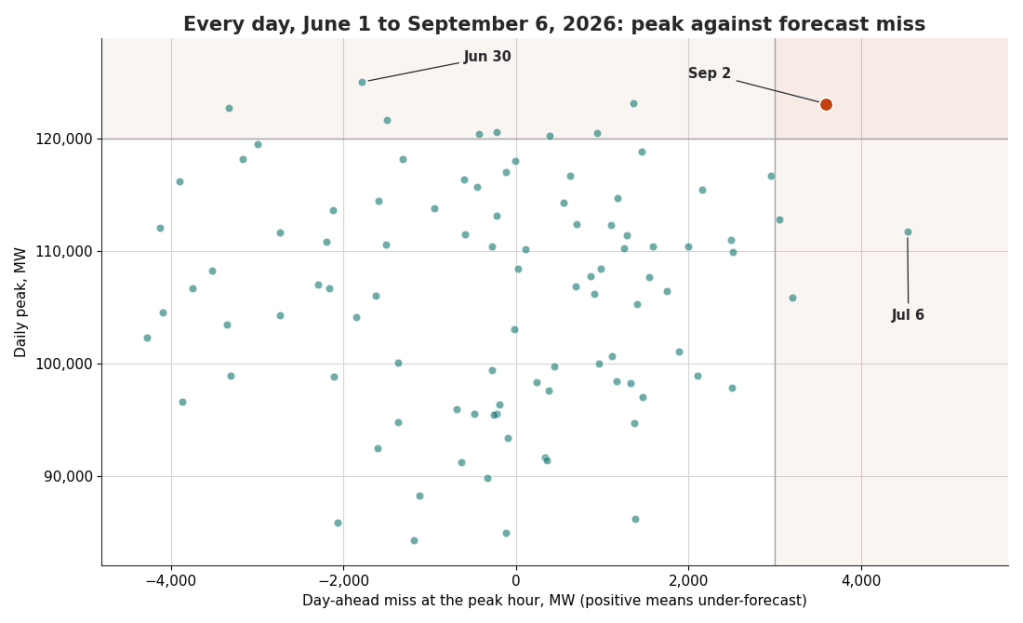
That is the whole argument in one picture. September 2 was not the biggest day and it was not the worst forecast. It was the only day that was close to both at once.
That set the stage. It did not pull the trigger.
The third condition: the imports went away
At 7:40 PM ET, MISO was importing 11,400 MW from its neighbors. Twenty-five minutes later it was importing 6,900 MW.
The reason is a procedure called transmission loading relief, or TLR. When a transmission line or transformer is carrying more than it safely can, the coordinator responsible for it can call a TLR, and the scheduling system cuts, or curtails, the scheduled power deliveries whose flow crosses that element. The TLR is the order; the curtailments are the cuts it produces. The procedure does not ask who needs the power. A delivery into MISO gets cut if its path loads the constrained element, even while MISO is short. Level 3, the level called on September 2, cuts the lower-priority schedules first.
According to MISO’s review, three Level 3 TLRs were called that evening:
- PJM, the grid operator to the east, called one on a 500 kV line in Pennsylvania
- IESO, Ontario’s grid operator, called one on the Ontario to Michigan interface
- MISO called one on a transformer in Missouri
Figure 5 shows where they were.
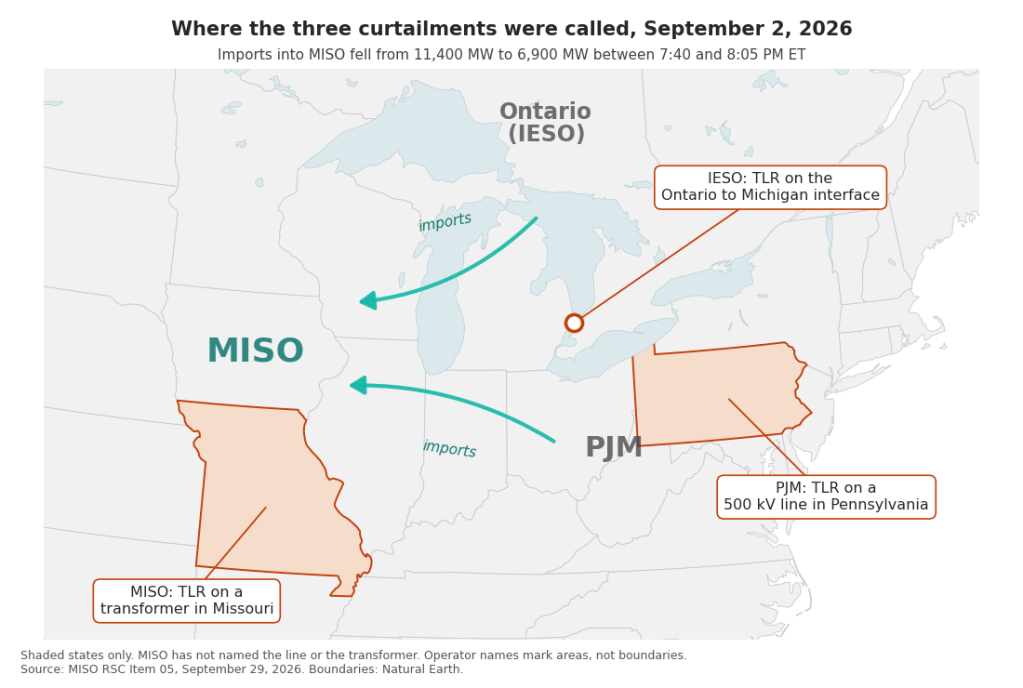
They did not arrive together. The review was presented on September 29 by the Manager of Shift Managers in MISO’s System Operations group, and he described the pattern as one TLR cutting a couple of thousand megawatts on fifteen minutes’ notice, then another arriving ten minutes later to cut a couple of thousand more. PJM’s and IESO’s did most of the damage. MISO’s own came about ten minutes after those and cut a few hundred megawatts. Together the three curtailed 3,900 MW of imports. He also confirmed to me by email that ordinary schedule changes account for the other 600 MW of the drop. MISO’s own TLR was on a transformer in my home state. MISO does not say which one, and I have not been able to find out.
The two big ones were probably linked. He was careful not to speak for PJM or IESO, but his reading was that the Pennsylvania line was congested, made worse by outages in the area, and that when PJM curtailed schedules across it, some of what it cut were IESO’s. IESO then called its own TLR to free up supply for itself. One probably led to the other. The outages matter here. September is when grid operators take equipment out for maintenance, because demand is normally falling, and MISO’s review lists the start of fall outage season among the conditions going into September 2. At the meeting MISO’s staff added that transmission construction was under way both inside MISO and among its neighbors.
MISO’s review also mentions a second supply problem: solar output fell off somewhat faster in the evening than MISO had forecast. At the meeting he played it down, calling it a typical evening ramp and saying the TLRs were what mattered most. The deck gives no megawatts for it, so I cannot size it, and I am not going to lean on it.
The timing lines up with figure 1, where the shaded band marks the twenty-five minutes of the import cut. Margin went from 6,476 MW at 7:30 PM ET to 204 MW at 8:15 PM ET, the same forty-five minutes that contain the import drop. My archive’s committed capacity series does not break out imports, so I cannot say how much of the 13,787 MW it lost over the evening was the curtailed schedules. MISO deployed its contingency reserves two minutes after the import low. On MISO’s chart, the frequency of the Eastern Interconnection, the single synchronized grid covering most of the United States and Canada east of the Rockies, dipped and recovered within about a quarter of an hour. Asked about that at the meeting, MISO said the dip was its own: its generators could not ramp up fast enough to replace roughly 4,000 MW of lost imports in a few minutes, and the whole interconnection felt it.
Frequency is the grid’s heartbeat. Every generator in the Eastern Interconnection spins in step at 60 cycles per second, or 60 hertz (Hz), and when demand outruns supply they all slow slightly. On September 2 the frequency fell to about 59.955 Hz by 8:00 PM ET, held there through the import low, and was back above 60 Hz by about 8:12 PM ET. It then ran a little high through the end of MISO’s chart at 8:30 PM ET as the response overshot, which MISO said is typical once reserves are deployed. Figure 6 traces it from MISO’s own chart.
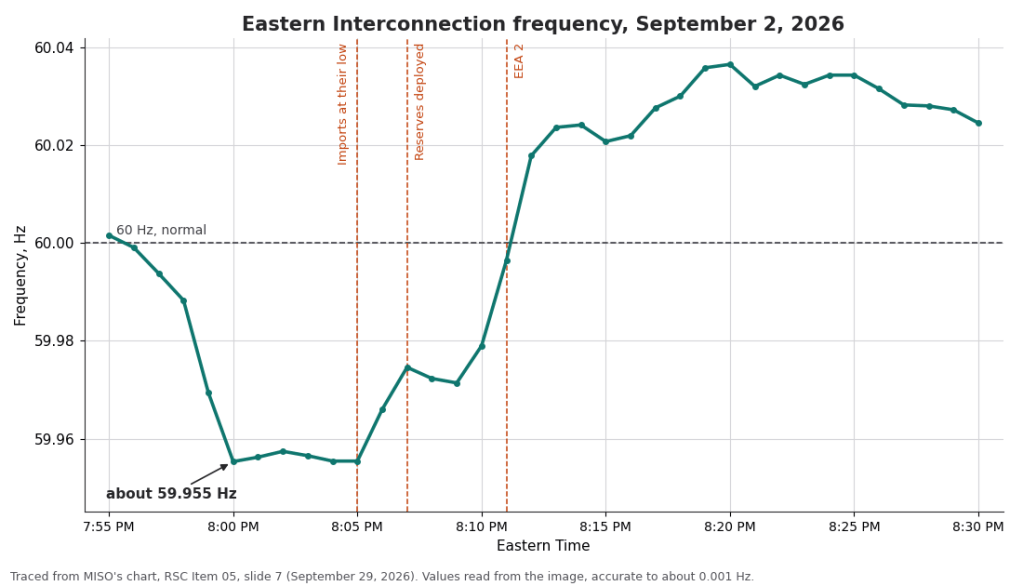
MISO describes a TLR curtailment this large, on this little notice, during peak hours, as rare. At the September 29 meeting, one longtime stakeholder said he could not remember TLRs causing a problem like this in decades, and MISO’s presenter called it an unusual event. Its review lists what it is looking at: closer coordination with PJM and IESO before large curtailments, staggering curtailments across an hour where the issuing coordinator allows it, and alternatives to TLRs for its own internal constraints, so that relieving one transformer does not cut supply in the middle of a capacity emergency. At the meeting MISO added one more. It is working with OATI, the company that runs the Interchange Distribution Calculator, the Eastern Interconnection’s tool for working out which schedules a TLR cuts, on whether a problem in that tool played a part. MISO had only just received that information and would not characterize it. It expects to bring a fuller account back to the subcommittee at a later meeting.
There is one more thing a TLR explains. It is a same-hour decision. It does not appear in an hours-ahead supply forecast, because it has not happened yet.
What the forward view showed, and what it did not
I keep an archive of MISO’s published forward view, which is refreshed every few minutes and contains, for each hour ahead, the forecast demand, the capacity MISO has committed, and the capacity MISO reports as available. From that I can replay exactly what the published picture looked like at any moment of the day.
At 3:45 PM ET, roughly four hours before the emergency, the view of the hour ending 8:00 PM ET read: forecast demand 119,561 MW, committed capacity 125,851 MW, available capacity 128,237 MW. Forward margin 6,290 MW. No hour from 5:00 PM ET to 11:00 PM ET showed a forward margin below 6,290 MW.
I also track what I call the uncommitted stack: available capacity minus committed capacity, which is the supply MISO says it has but has not yet instructed to run. On July 26 it fell to 1,245 MW for the evening hour by 6:55 PM ET, and the price hit $1,203 at 8:50 PM ET. On September 2 it never came close to that. Reading the evening hour at one hour or more of lead time, which is the window I report, it ran between 2,048 MW and 2,580 MW all day, and it was higher than on several calm days. Inside the last hour it falls to 745 MW, but by then the margin collapse is already on the screen and the stack is telling you nothing you did not know.
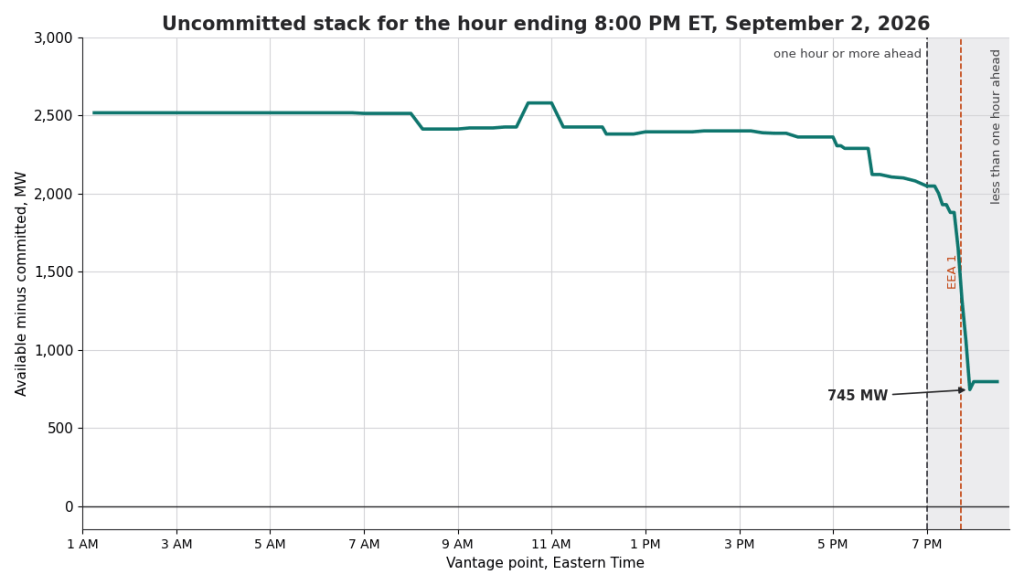
It is natural to expect the uncommitted stack to work as an early warning. It does not. In a five-day backtest, the stack on September 2 was healthier than on days when nothing happened, so it would have pointed the wrong way. I am leaving the chart in because a signal that fails is worth showing.
So on the supply side, MISO’s published forward view carried no warning by any construction I have tried.
The one signal that was there
The demand side is different, and this is where the two forecast products matter.
There are two things called MTLF, MISO’s Mid-Term Load Forecast. The Data Exchange returns the day-ahead run, initialized the day before and then fixed. The retiring market report file carried the last intraday revision. For the hour ending 8:00 PM ET on September 2:
- Day-ahead MTLF: 116,860 MW
- Intraday-revised MTLF, from the market report file: 117,016 MW
- Actual: 120,687 MW
Both forecasts were low. But watch what the intraday view did through the day.
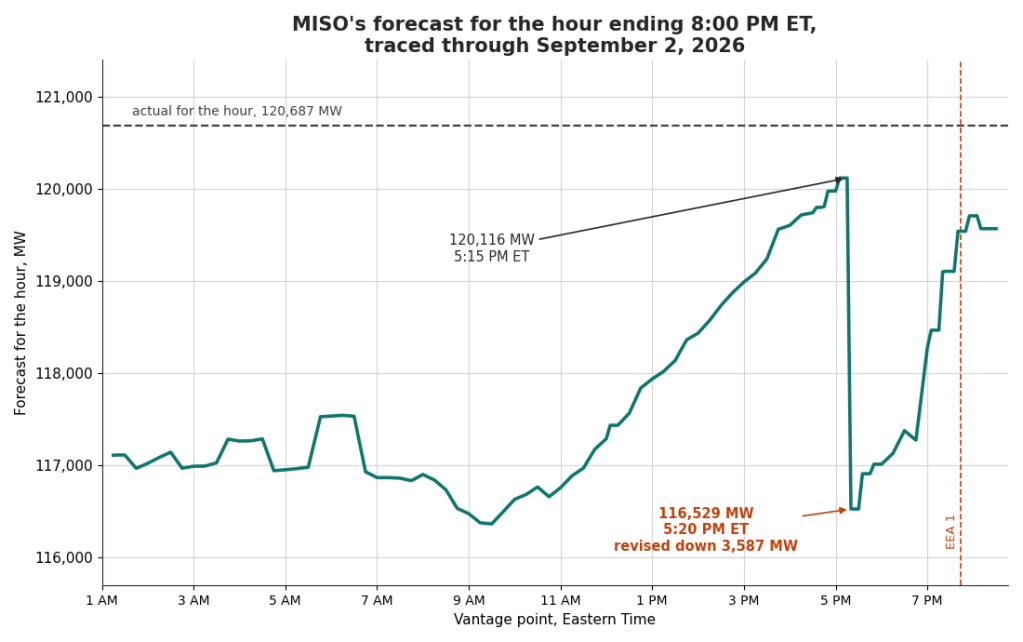
Through the afternoon MISO’s own forward view of that evening hour climbed steadily as the day got hotter, from 116,869 MW in the morning up to 120,116 MW by 5:15 PM ET. At that point it was within 571 MW of what the hour actually delivered. MISO had it very nearly right.
Five minutes later, at 5:20 PM ET, that forecast was revised down by 3,587 MW to 116,529 MW.
No other hour moved. The hours ending 6, 7, 9, 10 and 11 PM and midnight ET all drifted by a few tens of megawatts across the same step, which is normal. Only the hour that was about to break the system was revised, and it was revised in the wrong direction, from 571 MW away from the eventual actual to 4,158 MW away.
That was 2 hours and 24 minutes before the EEA 1 declaration.
I do not know why. A single-hour revision of that size, moving against the trend of every neighboring hour, is either a correction MISO had a specific reason for or a model artifact. What I can say is that the corrected view partly recovered afterwards, reaching 117,014 MW by 6:00 PM ET and climbing back through the 7:00 PM ET hour, and that MISO’s own declaration two hours later named “higher than forecasted load” as a cause of the emergency.
Two notes on the numbers in this section, since both changed what I thought I was looking at. The 117,016 MW above is the market report file’s final revision for that hour. The 117,014 MW is the forward view at the 6:00 PM ET vantage point. They are two megawatts apart because they are two different products, not because either is wrong. And if you compare only the top-of-hour snapshots at 5:00 and 6:00 PM ET, the revision reads as 2,961 MW and appears to happen at 6:00 PM ET. Sampling the feed every five minutes shows it as a single 3,587 MW step at 5:20 PM ET followed by a partial recovery. Coarse sampling moved both the size and the timing.
The morning after
On September 3, MISO’s day-ahead forecast ran 3,897.5 MW above actual. That is the largest over-forecast of September and the fourth largest of the summer, behind July 4, August 12 and August 6.
I am not going to claim that is a deliberate overcorrection, because I cannot see inside the model and a single day proves nothing. It is worth writing down and watching.
What I take from it
Grid emergencies get reported as though there is one cause. There usually is not.
September 2 was a workday in a heat wave, which put load near the top of the season. The day-ahead forecast was the second worst of the summer, concentrated in one northern zone. Neither fact would have made the news alone, and I can point at July 6 and June 30 to show it. Together they left MISO committing generation for a system 3.6 GW smaller than the one it actually had. Then, in the twenty-five minutes around the first declaration, a congested line in Pennsylvania set off a chain of curtailments through PJM and Ontario, a smaller one of MISO’s own in Missouri followed, and 3,900 MW of imports were cut. The cushion ran out at 8:15 PM ET with 204 MW to spare.
None of the forward supply numbers warned of trouble, and with MISO’s review in hand, that makes sense. A large share of the supply lost that evening came from import cuts ordered with fifteen minutes’ notice, and no forecast made hours earlier could have included them. The demand numbers were different. At 5:15 PM ET, MISO’s own forecast for the hour ending 8:00 PM ET was 120,116 MW, within 571 MW of what actually arrived. Five minutes later, MISO cut that forecast by 3,587 MW, even though demand for that hour came in higher. A big cut to a forecast that was nearly right is visible in the data hours ahead. What I do not know yet is whether it means anything. If cuts that large happen often on days when nothing goes wrong, they are noise; if they show up mainly before trouble, they are a warning. One day cannot settle that, so that is the next question I want to answer.
A few notes on the data. The peak figures here are demand as reported. MISO simplified its Maximum Generation Event steps on June 1, 2026, folding a five-step structure with letter sub-steps into three steps aligned to the NERC alert levels, which is why the September 2 notifications read “Step 1” and “Step 2” with no letter where older declarations read “Step 1b” and “Step 2a”.
Under the current structure, calling on load modifying resources, meaning customers under contract to cut demand during a declared emergency, is one of a broad set of actions available inside Step 2 rather than a step of its own, and the public notifications do not say whether MISO used it. At the September 29 meeting, one member utility asked MISO to say more, during any future Step 2, about which actions it is actually taking. The same MISO manager confirmed that MISO did not schedule or implement load modifying resources as part of Step 2 on September 2. Whether any companies cut load on their own, without instructions from MISO, is not known, so I have not adjusted for curtailment in either direction.
MISO has announced that it will stop posting its Pricing and Load, Generation, and Interchange market reports in favor of the Data Exchange API, with already-posted files remaining until they expire. The date has moved twice: from December 12, 2025, to September 30, 2026, and then, according to MISO’s liaison report for its October 1, 2026, Market Subcommittee meeting, to March 25, 2027. I tested the replacement: it serves the day-ahead run and only the day-ahead run, so the intraday-revised figure quoted above will have no successor once the reports stop. The fifteen-minute forward view this post leans on comes from a different feed and is unaffected. Losing the intraday figure is a problem for another post.
I now post the daily numbers on X at @MISOGridWatch: the day’s peak demand, the margin and any emergency declarations, without the commentary.
Figures 1 through 4, 7 and 8 are rendered from my archived data. Figure 5 uses MISO’s review and Natural Earth boundaries, and figure 6 is traced from MISO’s own chart. All times are Eastern (ET), converted from MISO’s year-round EST timestamps.

