Part 4 of a series on what I learned by accident when I started paying attention to my electricity bill.
I started this series four weeks ago with a story about my dishwasher. About switching to Ameren Missouri’s Ultimate Saver rate plan, about figuring out that 10 PM was a meaningful number, about the small habit shift that came out of it.
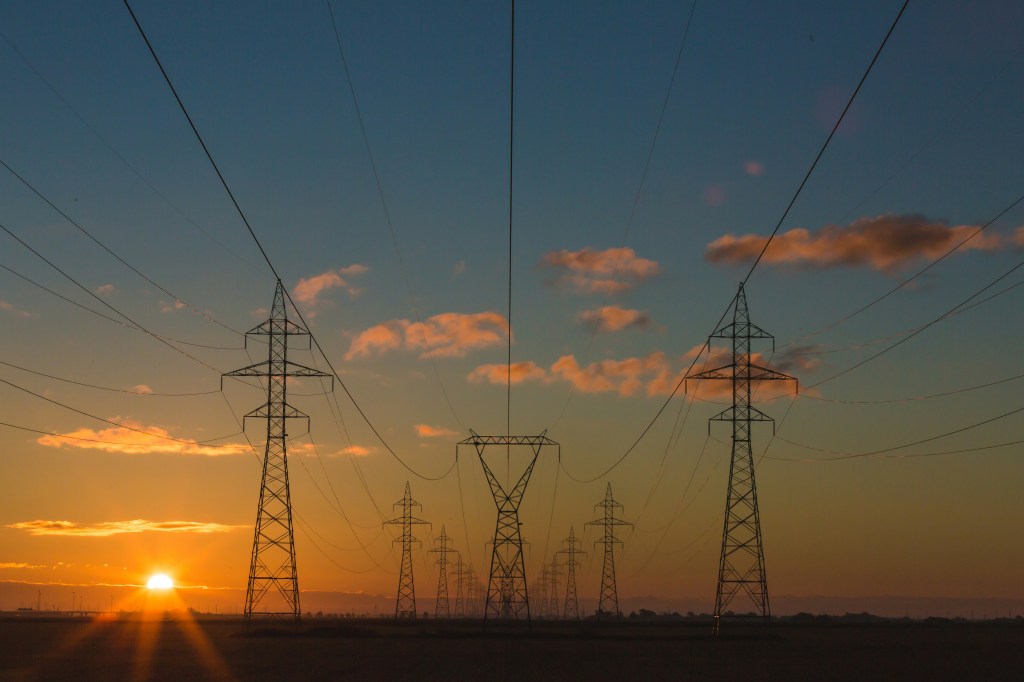
Then I spent three posts pulling at the thread that started with my dishwasher. I wrote about how a continental-scale power grid actually works and how it almost broke in 2003. I wrote about how a new category of customer is now creating conditions that look uncomfortably similar to 2003, on purpose, at scale, with the explicit acknowledgment of the regulators that they cannot keep up. Along the way I told you about megawatts and gigawatts and the May 2026 NERC alert, about hyperscalers building their own private power generation outside the regulated planning process, about an honor system that depends on data center operators picking up the phone when grid operators call.
I want to bring all of this back to where it started, which is my electric bill. And yours. Because the buildout I described in Post 3 is not happening in some abstract national context that doesn’t affect ordinary residential customers. It is happening, and it is going to show up on your bill, and the question worth asking is what that looks like and what, if anything, you can do about it.
That’s what this post is about.
Capacity prices, and why they matter to you
The first thing worth understanding is that your electric bill is not just paying for the electricity you used last month. It is also paying for the capacity that has to exist in order to serve you when you need it.
This works like an insurance pool. The utility, and the regional grid operator, have to maintain enough generation and transmission capacity to meet the worst-case demand on the worst possible day, plus a reserve margin in case some of that capacity fails. That capacity costs money to maintain whether you use it or not. The cost of maintaining it gets recovered from customers, spread across everyone, embedded in the rates you pay every month.
The wholesale market that determines how much that capacity costs is called the capacity market, and in MISO, the regional grid operator for Missouri and 14 other states, the capacity market runs annual auctions to determine prices. For most of the past decade, those prices were stable, low, and not particularly newsworthy. As recently as the 2024 to 2025 planning year, MISO’s capacity cleared the auction at about thirty dollars per megawatt-day.
In the auction for the 2025 to 2026 planning year, capacity prices jumped to six hundred sixty-six dollars per megawatt-day. That is a twenty-two-fold increase in a single year. The capacity market is, in effect, screaming that the system is running out of margin.
There is no version of that increase that does not, eventually, find its way into retail electricity rates. The math is unavoidable. Utilities buy capacity through these markets. They pay the cleared price. They recover that cost from customers. A twenty-two-fold increase in wholesale capacity prices does not stay wholesale.
What it means in practice is that even if you used exactly the same amount of electricity this year as you did last year, even if your behavior did not change at all, the underlying cost of keeping the grid available to serve you has gone up dramatically. Some of that cost is already showing up in rate cases being filed by utilities right now. Most of it has not arrived yet. It will.
Who pays when the biggest customers leave
There is a second, more subtle problem that I want to spend a moment on, because it explains something that I think most residential customers are about to start noticing without understanding why.
In Post 3, I described how hyperscalers are increasingly building their own behind-the-meter generation rather than relying on the public grid. Roughly forty gigawatts of announced private generation, dedicated to specific data center projects, going up outside the regulated utility planning process.
When a large customer leaves the grid, or never connects to it in the first place, that customer stops contributing to the cost recovery base that the utility uses to maintain its infrastructure. The transmission lines, the substations, the distribution network, the customer service systems, all of these have fixed costs that have to be paid for somehow. The utility traditionally recovers those costs across all of its customers, with the largest customers paying the largest share.
If the largest customers leave, the fixed costs don’t go away. They get redistributed across the customers who remain. Which is you and me.
This is not hypothetical. It is already a contested issue in rate cases in several states with significant data center buildout, where residential customer advocates are pushing back against rate increases that effectively transfer infrastructure costs from large commercial customers to residential ones. The legal and regulatory mechanisms here are complicated, but the basic dynamic is simple: when the biggest customers exit, the remaining customers carry more of the fixed cost burden, even if their own electricity usage hasn’t changed.
The Trump administration introduced something called the Ratepayer Protection Pledge in March of this year, which is intended to push some of the infrastructure costs back onto the hyperscalers that are driving demand growth. Whether it actually accomplishes that is going to depend on how state regulators interpret and implement it, which is going to vary state by state. The fundamental tension, that the public grid is increasingly being asked to socialize costs that benefit private corporations, is not going away.
What rate design is going to look like
The combination of rising capacity costs and shifting fixed-cost recovery is going to push utilities toward more aggressive rate designs for residential customers. Not because utilities are villainous, but because the math of running a grid in this environment forces it. There are a few patterns that I expect to see become more common, and that I think are worth understanding now rather than being surprised by later.
The first is the expansion of time-of-use pricing. Right now, most residential customers are still on flat rates, where you pay the same per kilowatt-hour regardless of when you use it. The Ultimate Saver plan I’m on, which differentiates between on-peak and off-peak hours, is still a minority choice in most utility territories. That is going to change. As the difference between peak and off-peak costs grows, utilities will increasingly push customers toward time-varying rates, sometimes by making them the default option and requiring customers to opt out rather than opt in.
The second is the introduction of demand charges for residential customers. Demand charges have historically been a commercial and industrial customer concept. The Ultimate Saver plan applies them to residential customers, which is unusual today but probably not unusual in five years. As more customers shift to time-of-use rates, the utility’s incentive to also charge for peak demand, not just peak energy usage, grows. Expect to see this spread.
The third is dynamic pricing, sometimes called critical peak pricing or real-time pricing. This is where the price of electricity varies not just by time of day on a fixed schedule, but in response to actual grid conditions. On extreme demand days, when the grid is genuinely stressed, the price spikes, sometimes dramatically, for a few hours. Customers who can shift their usage during those hours save significant money. Customers who can’t, or who don’t pay attention, get hit with bills that can be five or ten times what they would have paid otherwise.
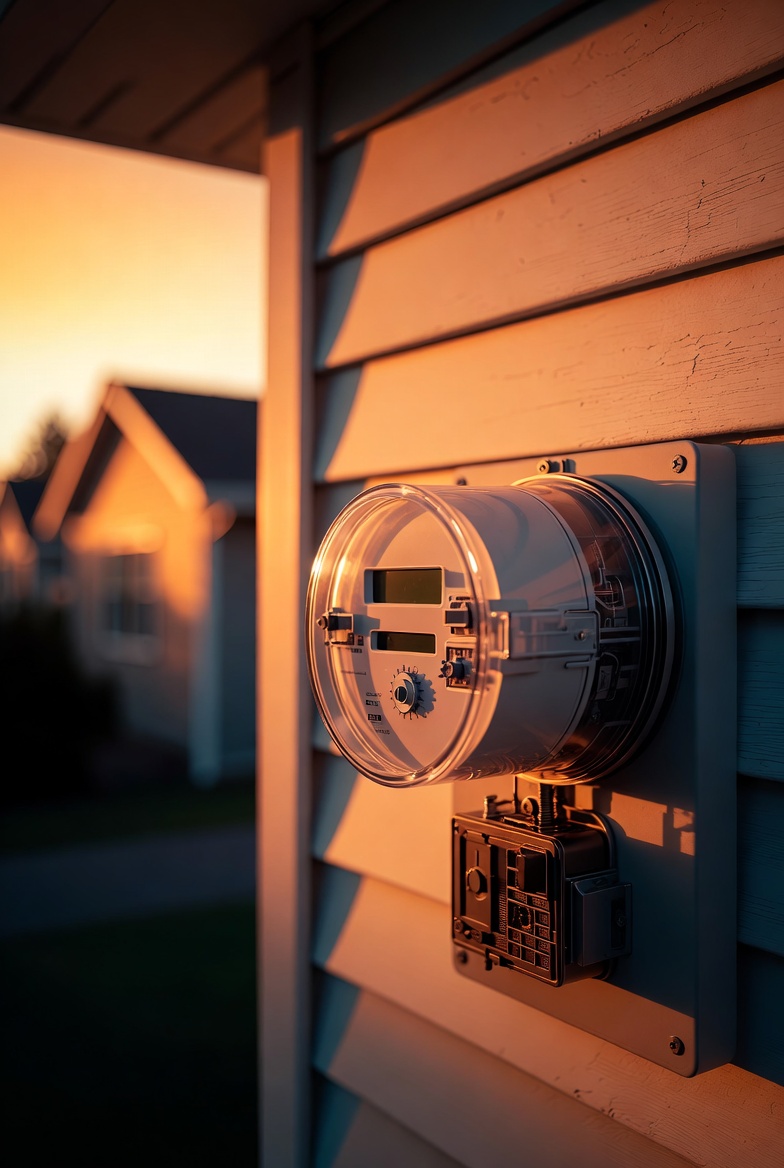
The fourth is more granular metering and pricing in general. Smart meters, which have been deployed across most of the country over the past decade, enable rate structures that simply were not possible before. Most utilities have only begun to take advantage of what those meters can support. That’s going to change.
None of this is automatically bad. The reason these rate structures exist is that they more accurately reflect the actual cost of serving each customer. A flat rate hides the cost of peak capacity behind an averaged price. Time-of-use rates and demand charges make those costs visible. For customers willing to engage with the structure, the result can be a lower bill. For customers who don’t engage, the result can be a higher bill, sometimes much higher.
What you can actually do
I’m going to be honest about this part: the things ordinary ratepayers can actually do to manage what’s coming are limited. The fundamental dynamics of capacity prices, infrastructure cost recovery, and grid stress are not going to be solved by individual residential decisions. But there are a few things that are within your control, and they’re worth doing.
The first is to actually look at the rate plans your utility offers. Most utilities have several rate plans available, and the default plan is almost never the optimal one for any specific household. If your utility offers a time-of-use plan or a demand-charge plan, look at it carefully. Estimate what your bill would have been under each option, using your actual usage data, which most utilities will provide on request. The right plan for your household depends on your specific load profile, and you cannot pick the right plan without looking.
The second is to learn your own load profile. When does your house actually use the most electricity? What’s running at 7 PM on a hot Tuesday in July? What’s running at 11 PM on a Sunday in March? Most people have no idea what their actual usage pattern looks like, and they are surprised when they look. Your utility’s customer portal almost certainly provides hourly usage data going back at least a year. Spend an hour looking at it. You will learn things about your house that you did not know.
The third is the behavioral shifts I started this series with. If your utility’s rate structure rewards off-peak usage, the shift is small and the savings are real. Running the dishwasher at 10 PM instead of 7 PM. Doing laundry on weekends. Pre-cooling the house before peak hours in summer. None of this is dramatic. None of it requires equipment upgrades or lifestyle compromises. It just requires paying attention.
The fourth, and the one that I think most residential customers will never do but that genuinely matters, is to engage with the regulatory process. Rate cases happen in every state, multiple times per year, with very little participation from residential customers. The people who do show up, ratepayer advocates, large commercial customers, environmental groups, are the ones whose interests get represented in the final outcome. If you have strong opinions about how the costs of the grid should be allocated, the place to express those opinions is in your state’s public service commission proceedings. They publish notices. They accept public comment. Almost no one reads the notices or submits the comments.
Bringing it home
I started this series with a small thing. A rate plan. A dishwasher. A question about why 10 PM specifically.
What I learned in the process is that the grid is bigger and more delicate and more interesting than I had any idea, and that the system it has to serve is changing faster than it can adapt to. The story I told across these four posts is not a hopeful one, exactly. It is not a hopeless one either. It is a description of a complicated piece of infrastructure trying to handle a new set of demands under regulatory rules that were not designed for them.
The dishwasher decision is still a small thing. It saves me maybe twenty dollars a month, on a good month. The grid is going to keep working, mostly, for most people, most of the time. The buildout I described will probably resolve into something stable eventually, although the path between here and there is going to be bumpier than most people expect, and the costs are going to be distributed in ways that are not particularly fair.
What I take away from writing this series is that paying attention is genuinely useful, both to my own bill and to my own understanding of the world I live in. Most of us are connected to a continental-scale machine that we know almost nothing about, that is going through the biggest stress test in its history, and that we are nonetheless going to keep depending on for everything we do. The least I can do is know what’s on the other side of my wall outlet.
That, in the end, is what my electric bill taught me.
Thanks for reading.
This concludes the four-part series. If you want to revisit any of the previous posts: Part 1 is here, Part 2 is here, Part 3 is here.