Note: Updated August 25, 2026, following MISO’s post-event reviews at the August 18 Reliability Subcommittee and August 20 Market Subcommittee meetings. MISO declared a Market Implementation Error on July 22 and recalculated the evening’s prices. The original figures remain below, marked where superseded, with details in the addendum at the end.
It started with a notification at 9:07 AM.
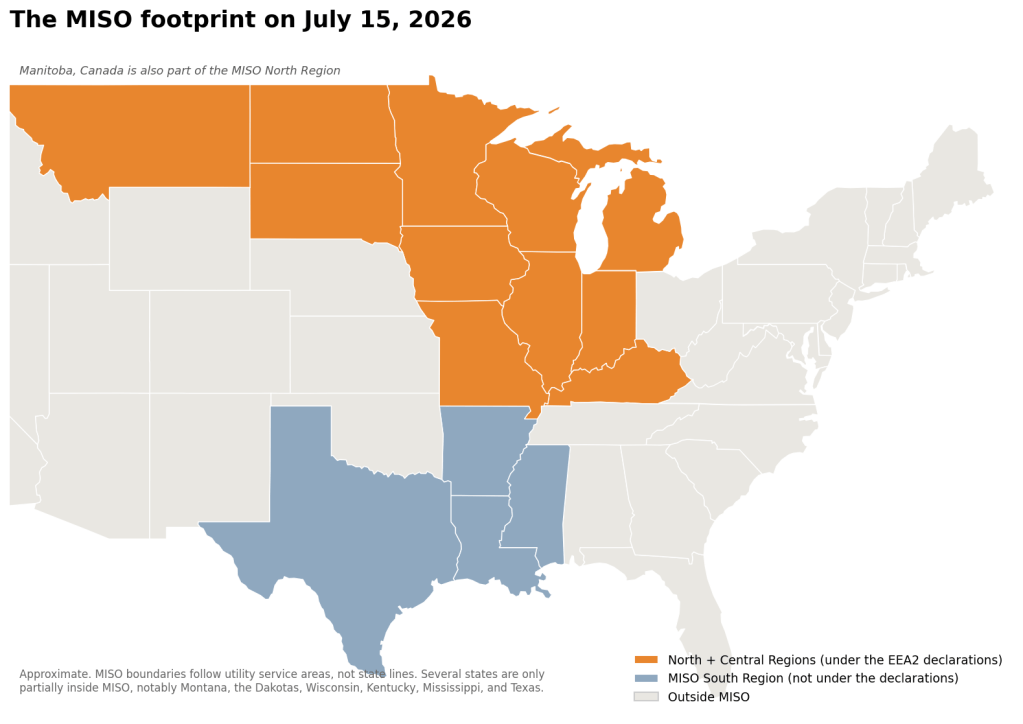
I run a small script that collects data from MISO, the Midcontinent Independent System Operator, the organization that runs the bulk electric grid for 45 million people across the middle of the continent, from Manitoba to the Gulf of Mexico. My house in eastern Missouri sits inside its footprint. I am not a grid operator. I am the person who wanted to understand what the numbers on my electric bill actually meant, and who kept pulling on that thread until it led here. On the morning of Wednesday, July 15, the thread pulled back.
The notification was a Maximum Generation Warning, published at 9:07 AM ET. In MISO’s vocabulary, a Warning means the grid operator believes that every economic power plant it can call on will be committed to meet demand, and it is concerned about holding the required safety cushion of reserves on top of that. It is not an emergency. It is the announcement that the emergency toolkit is being taken down off the shelf. The Warning would not even take effect until 2:00 PM ET. The most dangerous grid day of the summer had announced itself at breakfast.
By dinner, MISO would be in the first Energy Emergency Alert Level 2 it has ever declared in the heart of summer. This post is about what actually happened in between, told from data I archived while it was happening. The story the numbers tell is not quite the story the headlines told.
The view from outside
If you watched the news that evening, you saw a simple story. Record heat. Air conditioners straining. A grid pushed to its limit by demand. All of that is true as far as it goes. It was brutally hot across the entire middle of the country, and demand did crest at 122,627 megawatts at 4:15 PM ET, roughly 4,500 megawatts shy of MISO’s all-time record of 127,125 MW, set on July 20, 2011. For scale, a house running its air conditioner flat out on an afternoon like this draws around five kilowatts, which makes one megawatt about 200 homes at full blast. The 1,000 homes per megawatt figure you sometimes see quoted is an annual average, not a peak number.
But heat was the stage, not the plot. To see the plot, you need to look at the supply side of the ledger, and you need to look at it twice in the same day.
The ladder
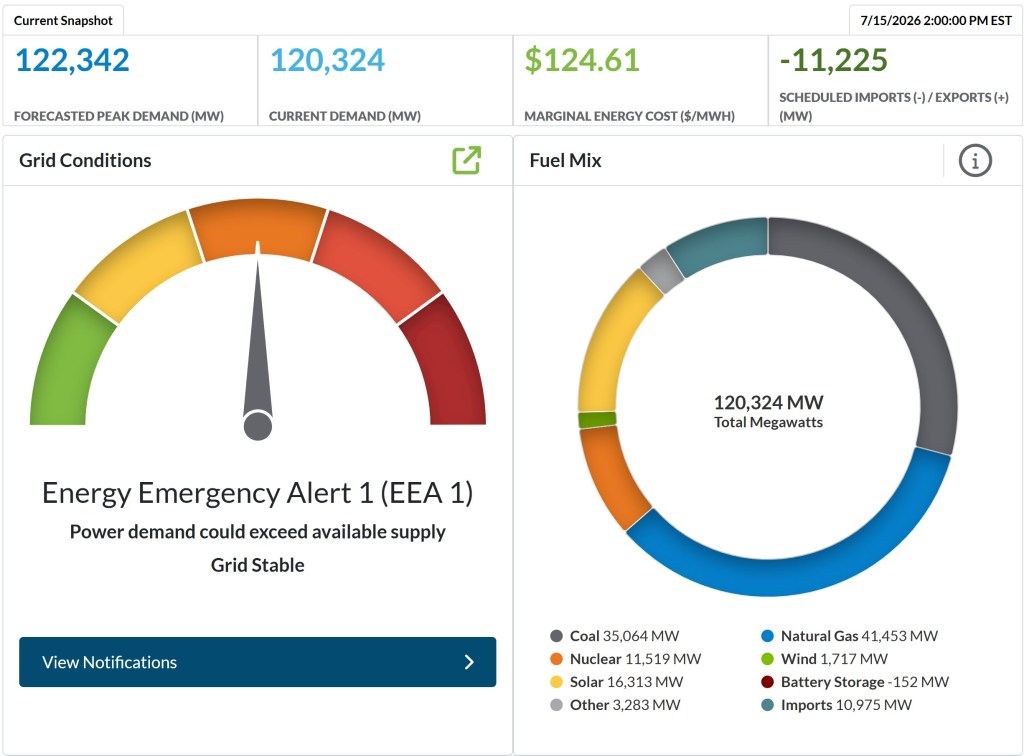
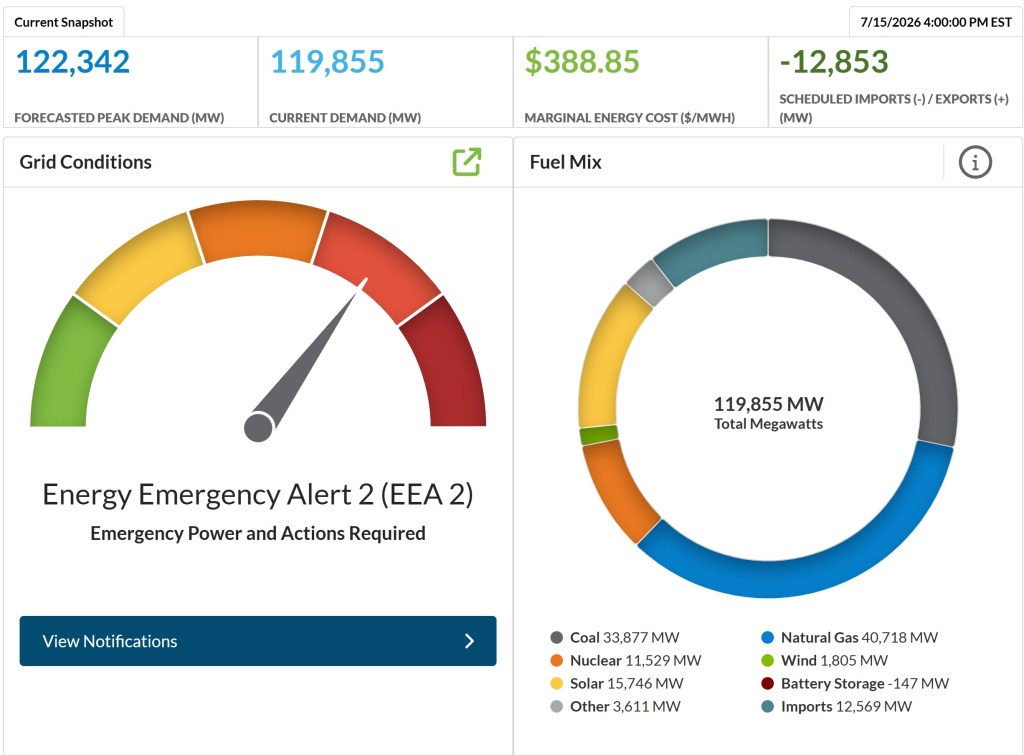
First, a map of the territory. MISO’s emergency procedure is a ladder, and as of June 1 of this year it has three numbered rungs, each aligned with a federal emergency level called an Energy Emergency Alert, or EEA. Below the numbered rungs sit the preliminary postures, the Warning among them. Step 1, which is EEA1, unlocks the emergency operating ranges of the generation fleet, squeezing megawatts out of plants beyond their normal comfortable maximum. Step 2, which is EEA2, is the big one short of disaster. It opens the full toolkit: load modifying resources (large customers who have agreed, in exchange for payment, to cut their usage when the grid calls), emergency purchases from neighboring grids, and public appeals for conservation. Step 3 is EEA3. That is the level where rotating outages become possible, and even then, in MISO’s own words from the procedure revision, load shedding is “not necessarily automatic.”
Here is how July 15 climbed it. Every declaration was published hours before it took effect, which is worth pausing on. A capacity emergency, unlike a storm, arrives by appointment.
- 8:53 AM ET. MISO updates a Conservative Operations declaration that had already been in effect since Monday, citing hot weather and a tightening reserve margin. Conservative Operations is the grid equivalent of a hospital canceling elective surgeries, deferring non-essential maintenance to keep every resource available.
- 9:07 AM ET. The Maximum Generation Warning is published, effective 2:00 PM ET, for the North and Central Regions. Reasons given, in order: forced generation outages, above normal temperatures, higher than forecasted load.
- 11:12 AM ET. Maximum Generation Event Step 1, EEA1, published. Effective 3:00 PM ET.
- 2:19 PM ET. Maximum Generation Event Step 2, EEA2, published. Effective 5:00 PM ET, scheduled to run to 9:00 PM ET. Emergency Tier II pricing implemented.
- 6:20 PM ET. The step back down begins. A return to EEA1 is published, effective 6:30 PM ET.
- 6:52 PM ET. A further step down to Warning is scheduled for 7:30 PM. One minute later, at 6:53 PM, MISO cancels that schedule. The operators wanted another look.
- 7:46 PM ET. The step down to Warning is issued, effective immediately.
- 8:48 PM ET. MISO publishes the termination, effective 9:00 PM ET, seventy-two minutes before the 10:00 PM end it had on the schedule.
Zero customers were interrupted. The emergency ended early, in an orderly walk back down the same ladder it had climbed.
What the ledger said, morning and afternoon
Now the part that did not make the news.
My script pulls MISO’s public data on a schedule, and on July 15 I also pulled it by hand at moments that turned out to matter. One of the feeds is the generation outage table, which reports how many megawatts of power plant capacity are unavailable, split by category. A forced outage is the involuntary kind. A unit that breaks, or derates in the heat, or trips offline. Not maintenance that was scheduled months ahead. The broken-leg category, not the scheduled-surgery category.
Three snapshots of the same number, the forced outage megawatts for July 15 itself:
- Two days ahead (July 13 pull): 8,231 MW expected
- Morning of, 9:40 AM ET: 10,978 MW
- Afternoon, 3:10 PM ET: 15,453 MW
Between breakfast and mid-afternoon, 4,475 megawatts of generation moved onto the forced outage list. That is roughly the output of four large power plants, subtracted from the supply side of the ledger in the hours when the day was already at its tightest. Counting all categories, total unavailable capacity went from 31,395 MW in the morning pull to 36,231 MW in the afternoon pull. And compared with what the forward-looking view had expected just two days earlier, event day delivered nearly double the forced outages anticipated.
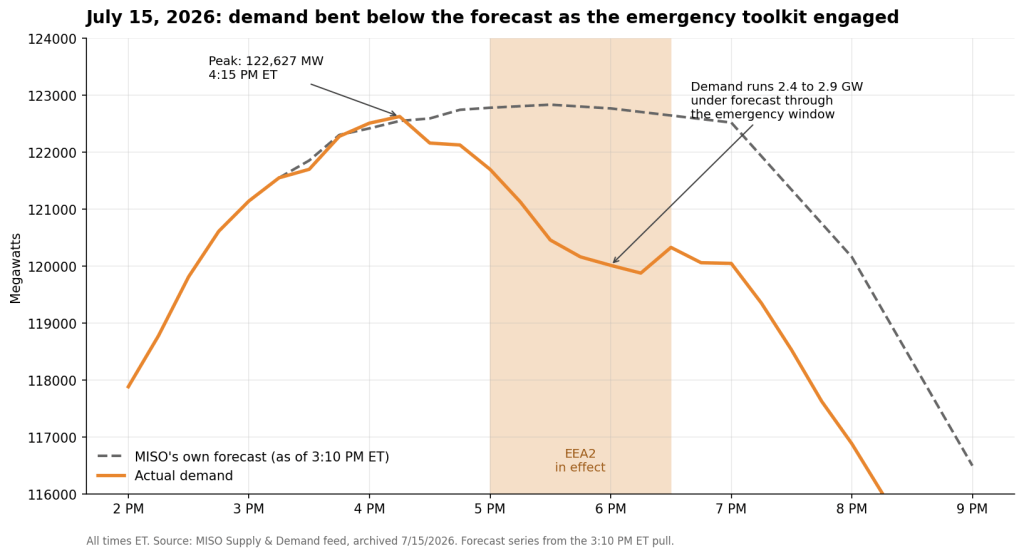
Meanwhile, the demand side behaved differently than the official reasons might suggest. “Higher than forecasted load” appeared on every declaration that day. My archive shows that during the emergency window itself, the opposite was true. At 3:10 PM ET, MISO’s own intraday forecast projected demand of about 122,800 MW for the late afternoon. The actuals came in at 121,699 MW at 5:00 PM, 120,458 MW at 5:30, and 120,014 MW at 6:00. Through the whole EEA2 window, demand ran 2.4 to 2.9 gigawatts below the forecast.
I am not going to tell you what to conclude from the juxtaposition. Both things are in the record. The declarations cited forced outages first among their reasons, and the outage table shows why. The declarations also cited higher than forecasted load, and the load data shows demand undershooting the forecast throughout the emergency hours. Some of that undershoot is the emergency toolkit working, which is the next section. Some of it may be forecast conservatism on a dangerous day. The numbers are above; the reader can weigh them.
The machinery, working
Three mechanisms carried the afternoon, and all three are visible in the data.
The first was borrowing. MISO imported power from its neighbors all day, and by evening the net imports reached 16,854 megawatts, close to seventeen gigawatts, an extraordinary volume. The deepest borrowing came at the end of the day, after the emergency declarations had already terminated. The paperwork expired at 9:00 PM. The dependence did not.
The second was commitment. Between 2:00 PM and 5:15 PM ET, the capacity MISO had committed and online rose from 126,783 MW to 135,308 MW. Eight and a half gigawatts added to the books in three hours, some of it those emergency operating ranges from the EEA1 declaration, some of it units racing to the field. You can watch the cavalry arrive in fifteen-minute intervals.
The third was demand itself bending. That 2.4 to 2.9 gigawatt gap between forecast and actual during the EEA2 window is the fingerprint of load modifying resources curtailing on instruction and of ordinary people easing thermostats upward. [Updated August 25.] MISO’s post-event reviews put the official number at 2,000 megawatts of load modifying resources, selected in real time and deployed with the EEA2 at 5:00 PM ET. The call did not last the planned window. With imports pouring in and the reserve margin recovering by roughly ten gigawatts, operators terminated the deployment about forty minutes in. MISO’s own two accounts disagree on the exact minute, 5:36 PM ET in the market review deck against 5:45 PM ET in the operations presentation, and the addendum returns to that gap. One more detail from the reviews deserves its own sentence: MISO cannot validate how the LMRs actually performed, because their metering is required only at hourly intervals and the deployment ran shorter than an hour. The most precisely dispatched tool of the afternoon is invisible to its own measurement.
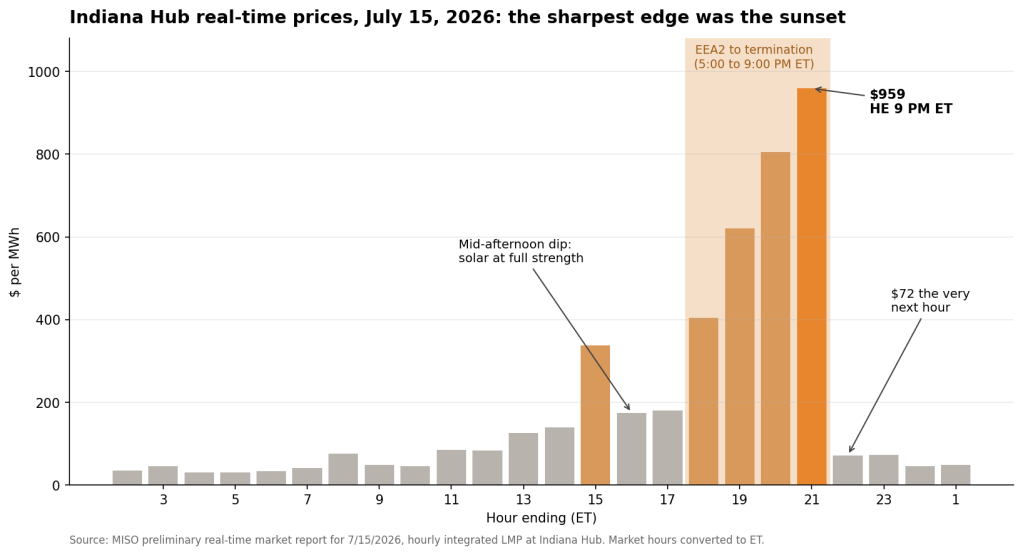
And over all of it, prices told the day’s story with brutal clarity. Wholesale electricity in MISO is priced by locational marginal price, or LMP, the cost of serving one more megawatt at a given place and time. At Indiana Hub, the benchmark trading location, the hourly real-time price opened the day near $35, sat at $49 during breakfast, and climbed as the outage list grew: $125 by midday, $337 by early afternoon. Then something interesting happened. Prices fell back to about $175 in the very hours demand was cresting, because sixteen gigawatts of solar generation were pouring in at full strength. The emergency’s sharpest edge was never the demand peak. It was the sunset. As solar faded from 15,035 MW at 6:00 PM to 7,726 MW by 8:00 PM, with wind delivering only 1,700 to 1,900 MW all evening, the price staircase went vertical: $405, $620, $806, and finally $959 for the hour ending 9:00 PM ET. The hour after termination, it was $72. From nearly a thousand dollars to seventy-two in a single step. By the day’s final market hour, $49, almost exactly where it began.
[Updated August 25.] The staircase above is the set of prices published that evening, and they are the prices the seventeen gigawatts of imports were answering. They are no longer the prices of record. When operators terminated the load modifying resources roughly forty minutes into the deployment, the termination never reached the pricing engine, so the software kept pricing an emergency the control room had already stood down, and ex-post prices climbed toward the $1,000 Emergency Offer Floor instead of stepping down. On July 22, MISO declared a Market Implementation Error, the Tariff’s term for a software flaw that produces prices misapplying the market rules, and recalculated the evening under Module C, Section 48.3. The recalculation window runs from the termination through 9:00 PM ET, which covers the staircase’s top steps. In the corrected record, the hours that published at $806 and $959 settle at a small fraction of those levels, set by less expensive resources under the recalculation; the exact corrected hourly values are in MISO’s reposted price files for July 15. The $72 hour and the $49 hour sit outside the window and stand. The addendum covers what the correction moved, and who objected.
How close was the real emergency?
The question my neighbors asked, once they learned what I watch all day, was simple. Were we close to the lights going out?
The honest answer has three layers.
Procedurally, EEA3 is one rung up the ladder, but the distance is bigger than one rung suggests. Inside Step 2, MISO deployed load modifying resources and emergency purchases, but it never issued formal public appeals for conservation, never drew down its operating reserves, and never made the deeper reserve call on neighboring grids. Several tools stayed in the box. EEA3 is declared when the toolkit is exhausted, and on July 15 it was not close to exhausted.
Physically, the question is what additional failure would have been required. Wind had little left to give, delivering under two gigawatts and missing even its own modest forecast. The realistic paths downward were another multi-gigawatt block of outages stacking onto the 15,453 MW already lost, or trouble on the far side of the border, because seventeen gigawatts of imports means seventeen gigawatts of dependence on neighbors having power to spare. The borrowing that saved the day is also, candidly, the day’s soberest number.
Historically, the record is reassuring in a specific way. In the modern record, MISO has ordered firm load shed, the deliberate interruption of customers, exactly three times. Roughly 500 MW during Hurricane Laura in August 2020, for a Louisiana pocket wrecked by transmission damage. 700 MW at the depth of Winter Storm Uri in February 2021, in the South Region. And approximately 600 MW directed around New Orleans on May 25, 2025, per MISO’s own event report, with roughly 500 MW of it landing across the metro area. All three in the South. None in the Midwest core. None larger than 700 MW on a system serving over 120,000 MW.
That last event carries a lesson worth separating out. New Orleans did not happen at the top of the capacity ladder. It happened through a different door entirely, a transmission security emergency, where an overloaded line threatens cascading failure and operators shed load with minutes of notice rather than hours. The capacity ladder is slow and announced. July 15 was a day spent partway up that staircase, with every step published in advance. The transmission door has no staircase. Understanding which door an emergency comes through is most of understanding how much warning you will get.
The winter rehearsal
Here is the part that convinced me this day deserved a full write-up rather than a thread. It had already happened once this year, in the cold.
On January 24, during Winter Storm Fern, MISO declared EEA2 for the North and Central Regions, the same two regions, the same rung of the ladder, in the same year. The parallels are almost uncomfortable. Fern’s emergency was outage-driven too, with unplanned generation outages exceeding 40 gigawatts at their peak, the overwhelming share concentrated in the North and Central regions. Fern deployed about 2 gigawatts of load modifying resources, the same scale as July’s demand response. Fern leaned on emergency purchases from PJM, the neighboring grid to the east, just as July leaned on imports.
And one difference makes the comparison sting, though not the way it did when I first published this. During Fern, a software failure kept emergency prices from publishing for roughly eleven hours. Prices on the screens did not reflect the emergency on the ground, which meant imports were never properly paid to show up. MISO shipped the fix on February 5, and on July 15 that fix held: emergency pricing engaged on schedule, the staircase climbed, and seventeen gigawatts came across the borders. The version of this section I published on July 17 ended there, with a clean verdict. In January the price signal was broken. In July it worked.
[Updated August 25.] The verdict was half right. What nobody outside the control room could see on July 15 was that a second, unrelated flaw in the same subsystem had already fired. The January failure kept emergency prices from turning on. The July failure kept them from turning off: when the operators stood down the load modifying resources, the pricing engine never received the signal and went on pricing the emergency for more than three hours, until the declarations themselves expired. MISO confirmed the error on July 22 and repriced the evening. So the clean verdict becomes a symmetrical one. In January the price signal failed to start. In July it failed to stop. Both failures were invisible to anyone whose lights stayed on, both happened in software that the availability dashboards scored as perfect, and both were caught, admitted, and corrected in public, which is worth something. But two for two is a pattern: the part of this machine that now breaks most often is not a generator or a wire. It is the software that tells the market what the grid is worth.
One year. Two seasons. Two EEA2s, same regions, same anatomy, and one pricing software failure apiece. The machine got tested in the cold, patched in February, and in the heat it passed the exam I was grading while failing one I did not know was on the schedule.
What EEA3 would have looked like at your house
Since the question deserves a concrete answer. If July 15 had gone one rung further, here is the sequence, for a reader in eastern Missouri.
MISO computes the shortfall in megawatts and allocates a share to each local utility. Ameren receives a number. Ameren implements it through pre-engineered rotating outage plans: feeder-level blocks, typically rotating every 30 to 60 minutes so no neighborhood carries the whole burden, with circuits serving hospitals, water treatment, and emergency services flagged for exclusion where the network allows. Wholesale prices go to the Value of Lost Load, an administrative ceiling meant to represent what interrupted service actually costs. That ceiling is currently $10,000 per megawatt hour, effective September 30, 2025, nearly triple the $3,500 that applied during the Laura event. The financial deterrent got steeper between the last EEA3 and any future one, which was the point.
And it is not hypothetical machinery. EEA3 has been declared twice on the capacity ladder in the modern record, and both declarations left a paper trail in MISO’s own emergency log. On August 27, 2020, as Hurricane Laura tore out transmission in western Louisiana, MISO declared EEA3 for the affected pocket with Value of Lost Load pricing in effect from 12:00 PM ET until nearly midnight. The log records 300 MW of load shed ordered at 1:02 PM ET, another 200 MW at 2:22 PM ET, and termination once transmission returned to service. On February 16, 2021, at the bottom of Winter Storm Uri, MISO declared EEA3 for the South Region at 7:40 PM ET and requested 700 MW of firm load shed ten minutes later. That declaration ran until 1:00 AM ET. In both cases, what customers experienced on the ground was the rotating-outage machinery described above, implemented by their local utilities, lasting hours rather than days, and lifted the moment conditions allowed.
It is machinery. Rehearsed, bounded, and used briefly, and never here. That is not a promise. It is a base rate.
The record, stated precisely
Claims like “first” deserve receipts, so here are mine. Against MISO’s own compiled declaration log covering 2009 through mid-2024, and against the individual records for every season since, July 15, 2026 was the first NERC EEA2 declared during MISO’s June-through-August summer season in the modern record. It was declared for the North and Central Regions, not the full footprint. The honest footnotes: MISO reached the equivalent market step without a NERC EEA2 declaration on June 10, 2021 and August 24, 2023, and a South Region EEA2 occurred on September 15, 2018, summer by the calendar though outside MISO’s June-through-August planning season. The nearest EEA2 in time was not years ago. It was January.
Summer capacity emergencies used to be a thing MISO wrote procedures about and winter storms delivered. As of this year, both seasons have produced one.
Yellow, not green
At 9:00 PM ET the declarations expired. My dashboard gauge did not go green. It went yellow, because Conservative Operations remained in effect through the end of the week, and out at the borders the imports were still running at their daily maximum after the emergency ended. The paperwork closed. The posture did not.
In the series that started with my electric bill, I argued that the margins on this grid are thinning, and that the interesting question is not whether the emergency toolkit works. July 15 is what a thinning margin looks like when the toolkit works: four large power plants’ worth of supply vanishing from the ledger between breakfast and mid-afternoon, absorbed by borrowing, commitment, demand response, and a price signal doing exactly what it was built to do, ending seventy-two minutes ahead of schedule with nobody’s lights out.
The toolkit worked in January. It worked in July. The question the data cannot answer, and the one worth sitting with, is how many times in a row it has to.
Addendum: the after-action record
Added August 25, 2026.
MISO reviewed July 15 twice, in the two halves it always uses. Operations at the August 18 Reliability Subcommittee, where the manager of shift managers walked through the decisions. Markets at the August 20 Market Subcommittee, where the Market Evaluation team walked through the prices. I attended both by WebEx, archived both recordings, and pulled the decks, the meeting minutes, and MISO’s July Monthly Operations Report. This addendum is what those materials add to the story above, and in one place, what they correct.
The pricing engine never got the memo. The evening price staircase carried a defect nobody outside the control room could see. When operators terminated the load modifying resources, the termination signal never propagated from the operator software to the pricing engine; MISO describes a connector between the two systems failing, says this was the first occurrence, and says a fix is in production. The engine kept pricing an emergency the control room had stood down. On July 22 MISO declared the Market Implementation Error and recalculated the evening under the Tariff, and the corrected prices became the basis for settlement.
The money. The recalculation moved $109 million in gross market activity between the original and corrected settlements. That is total activity across all parties, not one party’s loss, but the direction of specific pieces matters. Seller credits for imports into MISO fell by $20 million, which means the entities that answered the price signal are the ones handing value back. The make-whole uplift that spiked when the load modifying resources were setting the price fell by roughly 80 percent after the correction.
The objection, on the record. Devin Boyd of Macquarie Energy told the Market Subcommittee that importers cannot unwind physical deliveries after the fact, that materially revising prices after delivery creates an inequitable result for participants who relied on posted market information, and that if suppliers come to believe emergency prices may be rewritten afterward, they may be less willing to import during the next emergency. The comment was taken without response. MISO’s presenters pointed elsewhere to process improvements: faster identification of real-time pricing issues, stakeholder notification when one is found, and, longer term, automation that removes the human handoff from emergency pricing altogether.
The metric that measured the wrong thing. MISO’s July Monthly Operations Report tracks availability for its most critical systems. The Energy Management System shows zero minutes of unplanned unavailability in every month of 2026. The Unit Dispatch System shows one unplanned incident all year, in May. January and July, the two months in which pricing software failed, one for eleven hours and one for more than three, both score clean. The systems were up. The numbers were wrong. Availability metrics cannot see the difference, and this year they missed it twice. One dashboard metric did catch something: the divergence between day-ahead and real-time prices ran 39.4 percent in July against a 28.6 percent threshold, and January holds the year’s worst reading at 44.5. The two emergency months are the year’s two worst months for price divergence.
Records disagreeing with records. Two entries for the file. First, MISO’s own two accounts of the LMR termination minute differ: the Market Subcommittee deck says 5:36 PM ET, and the operations presenter said 5:45. Nine minutes, plausibly the difference between a declaration time and an effective time, but neither document says which is which. My archive cannot break the tie. The collector that now pulls MISO’s feeds around the clock ran for the first time at 9:17 PM ET that night; this event is the reason it exists, which means the event itself sits just before the archive begins. Second, the deck’s declaration timeline, revised once already on August 19, shows the step down to Warning taking effect at 6:52 PM ET. The notification stream I watched that evening published that schedule at 6:52, cancelled it at 6:53, and issued the actual step down at 7:46. The ladder section above stands on the notifications as they were published in real time. The original post closed on the difference between records and archives. I did not expect the first exercise of that distinction to be against the after-action report of the same event.
Demand, closed out. The market review quantified what my ledger section could only bracket: at the evening peak hour, actual load ran about 5 gigawatts under the forecast MISO was operating against, roughly 122 gigawatts against 127, with the LMR response, voluntary curtailment, and wildfire smoke all mixed into the gap and MISO explicitly unable to separate them. That figure uses a different forecast and a different hour than my 2.4 to 2.9 gigawatt measurement, so the numbers do not conflict; they are two rulers laid against the same undershoot. And the monthly report settled the framing question this post opened with. July’s system peak came on July 1, not July 15, and the RSC minutes record June 30 reaching 125.6 gigawatts. The summer’s only emergency did not arrive on the summer’s biggest day. Heat was the stage, not the plot, and MISO’s own numbers now say so too.
The other door, being rebuilt. The original post argued that knowing which door an emergency comes through, the announced capacity staircase or the no-notice transmission trapdoor, is most of knowing how much warning you will get. The trapdoor is being rebuilt. At the August 18 RSC, MISO walked through revisions to its Transmission System Emergency procedure: two new real-time declarations, IROL Emergency and Potential Cascading Emergency, with cascading analysis beginning at 115 percent of emergency ratings to buy detection time, targeted for implementation by the end of November. A stakeholder asked whether the earlier detection could have changed the May 25, 2025 New Orleans event. MISO’s answer, fairly summarized: earlier awareness, likely; a different outcome, it depends on the event. That is the honest shape of the improvement, and it is more warning than the trapdoor gives today.
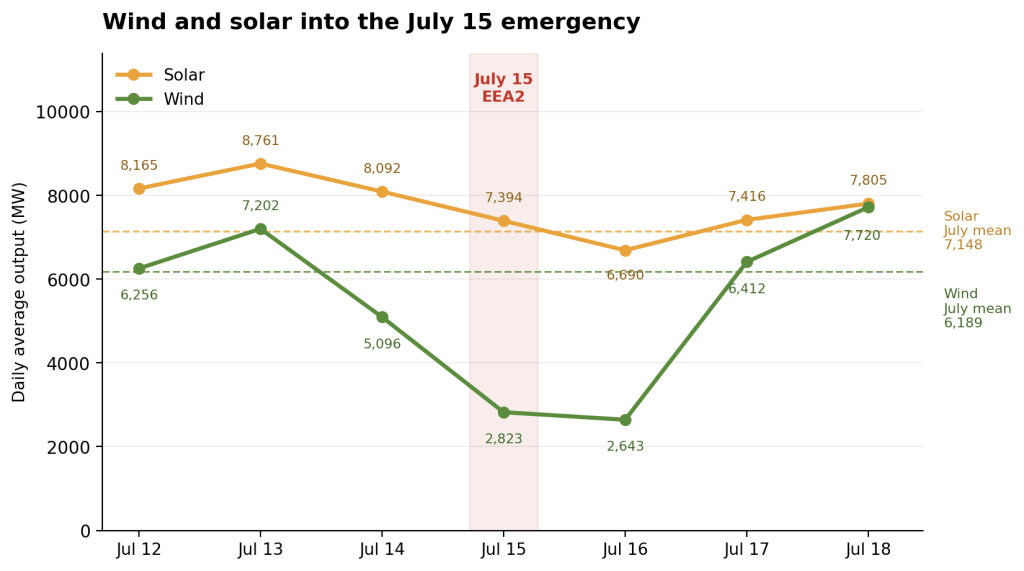
What the models could not see. Both reviews put wildfire smoke at the center, and in a stranger place than I expected. MISO said the smoke’s effect on solar forecasting was anticipated; what surprised them was its effect on load. The weather models feeding the intraday load forecast do not account for smoke at all, so operators spent the day reading forecasts built on a clear sky while a different day materialized outside, and the assessment team compensated by hand. PJM saw the larger load reduction, which is a large part of why PJM had reserves to sell, which is a large part of where my seventeen gigawatts of imports came from. So the same smoke bent the supply side and the demand side at once, in opposite directions, and neither effect was in any model. Solar and smoke forecast modeling is now the first item on MISO’s lessons-learned list, and when a stakeholder pressed for specifics on the fix at both meetings, the answer was that MISO is working with its vendors. Worth keeping in proportion, though: the numbers show solar on July 15 running slightly above the monthly average, and wind, not solar, at the floor.
The declarations closed at 9:00 PM on July 15. The record of that evening kept moving for another five weeks, and part of it is still disputed by its own authors. The archive is what lets me say which is which.


Leave a Reply