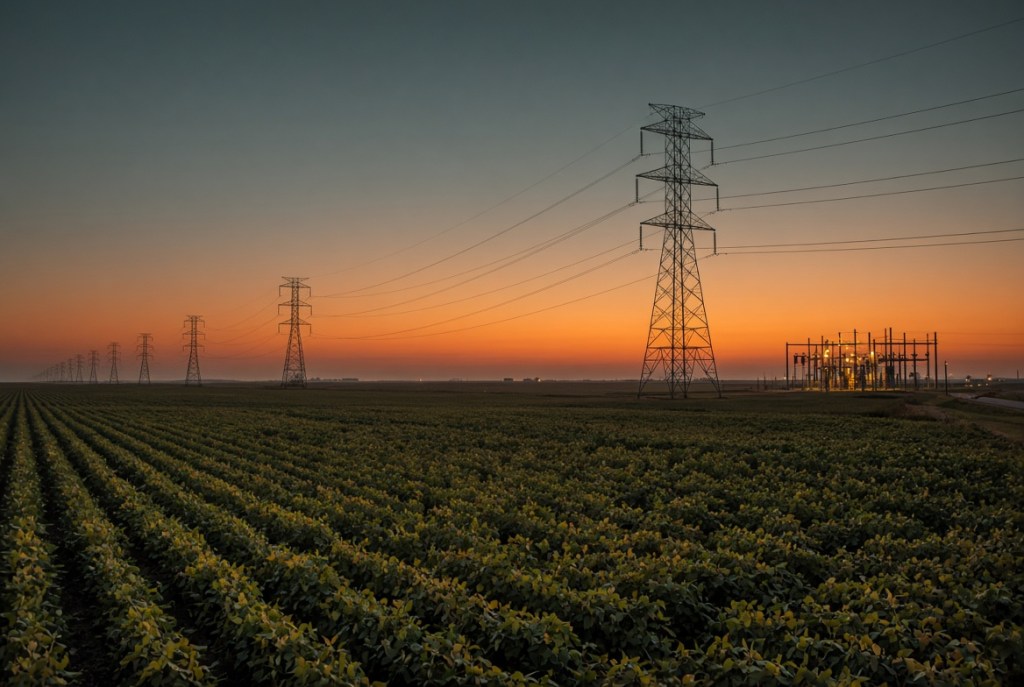
Tag: power grid

  • The Day 4,500 Megawatts Disappeared

    The Day 4,500 Megawatts Disappeared

    It started with a notification at 9:07 AM.

    I run a small script that collects data from MISO, the Midcontinent Independent System Operator, the organization that runs the bulk electric grid for 45 million people across the middle of the continent, from Manitoba to the Gulf of Mexico. My house in eastern Missouri sits inside its footprint. I am not a grid operator. I am the person who wanted to understand what the numbers on my electric bill actually meant, and who kept pulling on that thread until it led here. On the morning of Wednesday, July 15, the thread pulled back.

    The notification was a Maximum Generation Warning, published at 9:07 AM ET. In MISO’s vocabulary, a Warning means the grid operator believes that every economic power plant it can call on will be committed to meet demand, and it is concerned about holding the required safety cushion of reserves on top of that. It is not an emergency. It is the announcement that the emergency toolkit is being taken down off the shelf. The Warning would not even take effect until 2:00 PM ET. The most dangerous grid day of the summer had announced itself at breakfast.

    By dinner, MISO would be in the first Energy Emergency Alert Level 2 it has ever declared in the heart of summer. This post is about what actually happened in between, told from data I archived while it was happening. The story the numbers tell is not quite the story the headlines told.

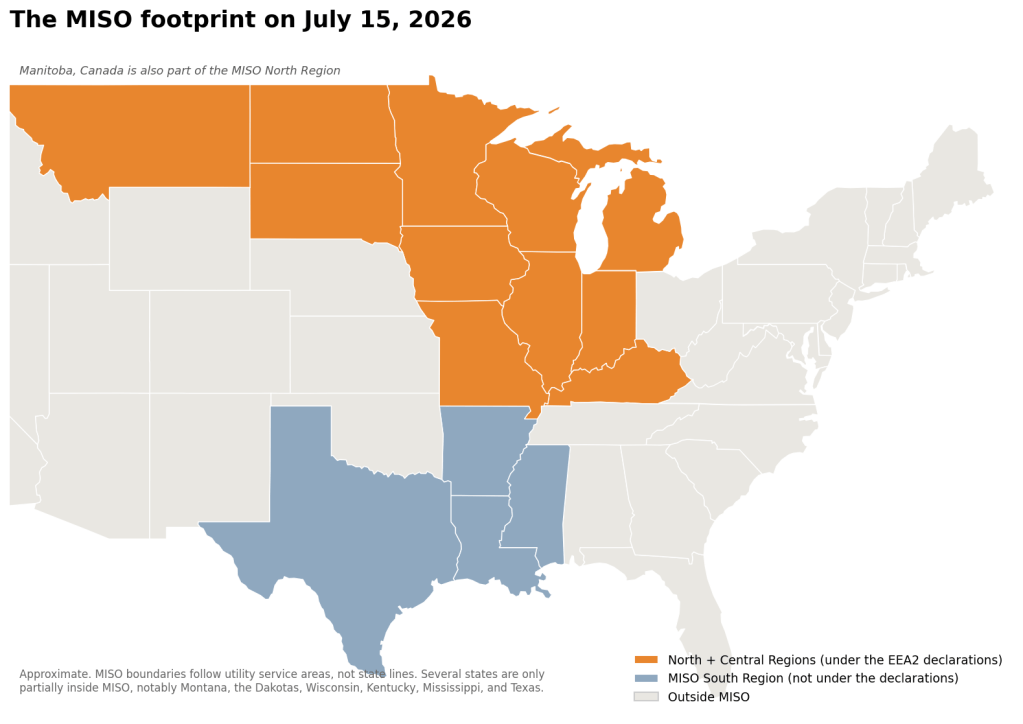
    MISO’s footprint, approximately. The July 15 declarations covered the North and Central Regions; the South Region was never under them.

    The view from outside

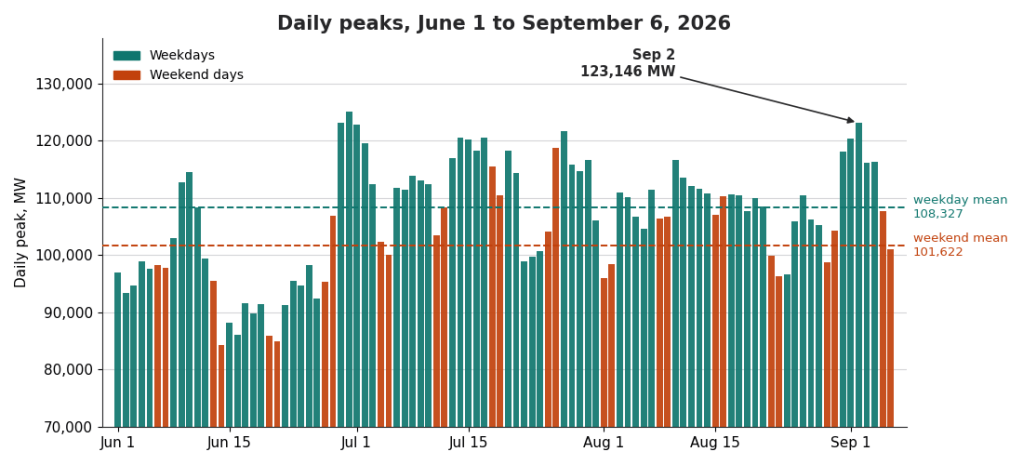
    If you watched the news that evening, you saw a simple story. Record heat. Air conditioners straining. A grid pushed to its limit by demand. All of that is true as far as it goes. It was brutally hot across the entire middle of the country, and demand did crest at 122,627 megawatts at 4:15 PM ET, roughly 4,500 megawatts shy of MISO’s all-time record of 127,125 MW, set on July 20, 2011. For scale, a house running its air conditioner flat out on an afternoon like this draws around five kilowatts, which makes one megawatt about 200 homes at full blast. The 1,000 homes per megawatt figure you sometimes see quoted is an annual average, not a peak number.

    But heat was the stage, not the plot. To see the plot, you need to look at the supply side of the ledger, and you need to look at it twice in the same day.

    The ladder

    First, a map of the territory. MISO’s emergency procedure is a ladder, and as of June 1 of this year it has three numbered rungs, each aligned with a federal emergency level called an Energy Emergency Alert, or EEA. Below the numbered rungs sit the preliminary postures, the Warning among them. Step 1, which is EEA1, unlocks the emergency operating ranges of the generation fleet, squeezing megawatts out of plants beyond their normal comfortable maximum. Step 2, which is EEA2, is the big one short of disaster. It opens the full toolkit: load modifying resources (large customers who have agreed, in exchange for payment, to cut their usage when the grid calls), emergency purchases from neighboring grids, and public appeals for conservation. Step 3 is EEA3. That is the level where rotating outages become possible, and even then, in MISO’s own words from the procedure revision, load shedding is “not necessarily automatic.”

    Here is how July 15 climbed it. Every declaration was published hours before it took effect, which is worth pausing on. A capacity emergency, unlike a storm, arrives by appointment.

    • 8:53 AM ET. MISO updates a Conservative Operations declaration that had already been in effect since Monday, citing hot weather and a tightening reserve margin. Conservative Operations is the grid equivalent of a hospital canceling elective surgeries, deferring non-essential maintenance to keep every resource available.
    • 9:07 AM ET. The Maximum Generation Warning is published, effective 2:00 PM ET, for the North and Central Regions. Reasons given, in order: forced generation outages, above normal temperatures, higher than forecasted load.
    • 11:12 AM ET. Maximum Generation Event Step 1, EEA1, published. Effective 3:00 PM ET.
    • 2:19 PM ET. Maximum Generation Event Step 2, EEA2, published. Effective 5:00 PM ET, scheduled to run to 9:00 PM ET. Emergency Tier II pricing implemented.
    • 6:20 PM ET. The step back down begins. A return to EEA1 is published, effective 6:30 PM ET.
    • 6:52 PM ET. A further step down to Warning is scheduled for 7:30 PM. One minute later, at 6:53 PM, MISO cancels that schedule. The operators wanted another look.
    • 7:46 PM ET. The step down to Warning is issued, effective immediately.
    • 8:48 PM ET. MISO publishes the termination, effective 9:00 PM ET, seventy-two minutes before the 10:00 PM end it had on the schedule.

    Zero customers were interrupted. The emergency ended early, in an orderly walk back down the same ladder it had climbed.

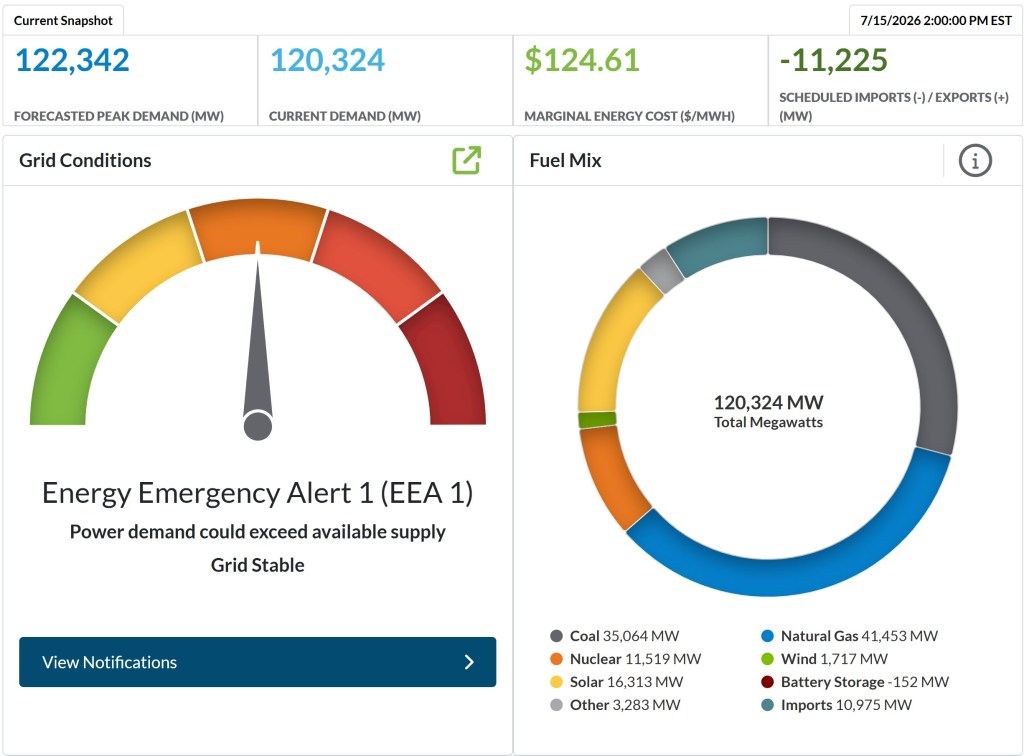
    3:00 PM ET: EEA1 in effect, marginal energy at $124.61. (The dashboard clock reads 2:00 PM EST; MISO labels its displays EST year-round, an hour behind Eastern in summer.)
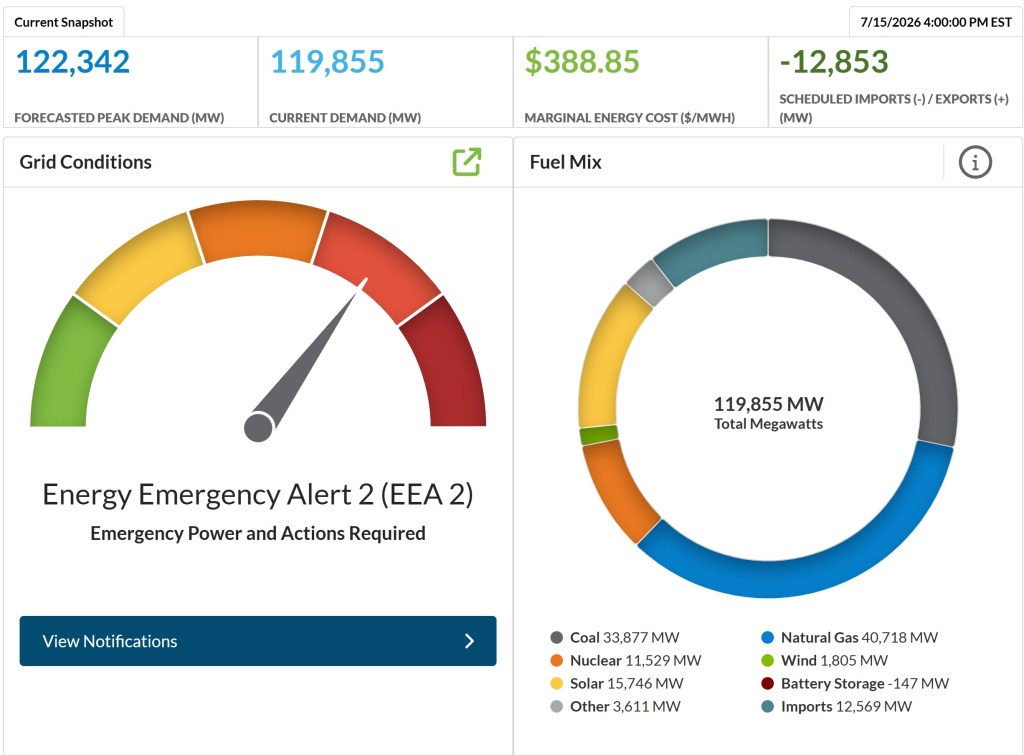
    5:00 PM ET: the EEA2 declaration takes effect. The needle steps into the dark orange and marginal energy has tripled to $388.85. (Dashboard clock: 4:00 PM EST, same labeling convention.)

    What the ledger said, morning and afternoon

    Now the part that did not make the news.

    My script pulls MISO’s public data on a schedule, and on July 15 I also pulled it by hand at moments that turned out to matter. One of the feeds is the generation outage table, which reports how many megawatts of power plant capacity are unavailable, split by category. A forced outage is the involuntary kind. A unit that breaks, or derates in the heat, or trips offline. Not maintenance that was scheduled months ahead. The broken-leg category, not the scheduled-surgery category.

    Three snapshots of the same number, the forced outage megawatts for July 15 itself:

    • Two days ahead (July 13 pull): 8,231 MW expected
    • Morning of, 9:40 AM ET: 10,978 MW
    • Afternoon, 3:10 PM ET: 15,453 MW

    Between breakfast and mid-afternoon, 4,475 megawatts of generation moved onto the forced outage list. That is roughly the output of four large power plants, subtracted from the supply side of the ledger in the hours when the day was already at its tightest. Counting all categories, total unavailable capacity went from 31,395 MW in the morning pull to 36,231 MW in the afternoon pull. And compared with what the forward-looking view had expected just two days earlier, event day delivered nearly double the forced outages anticipated.

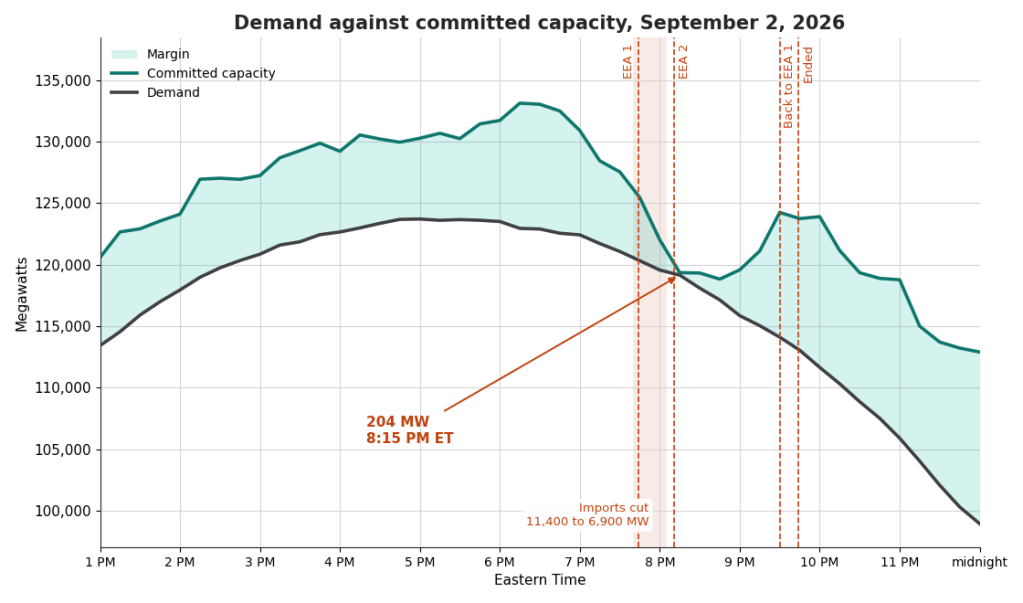
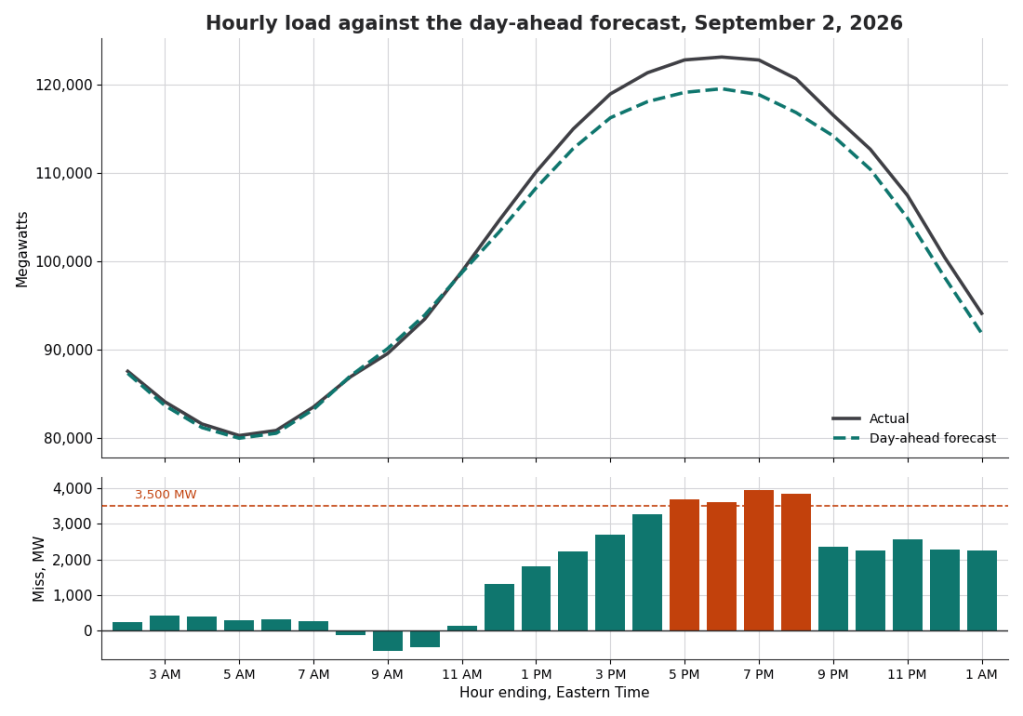
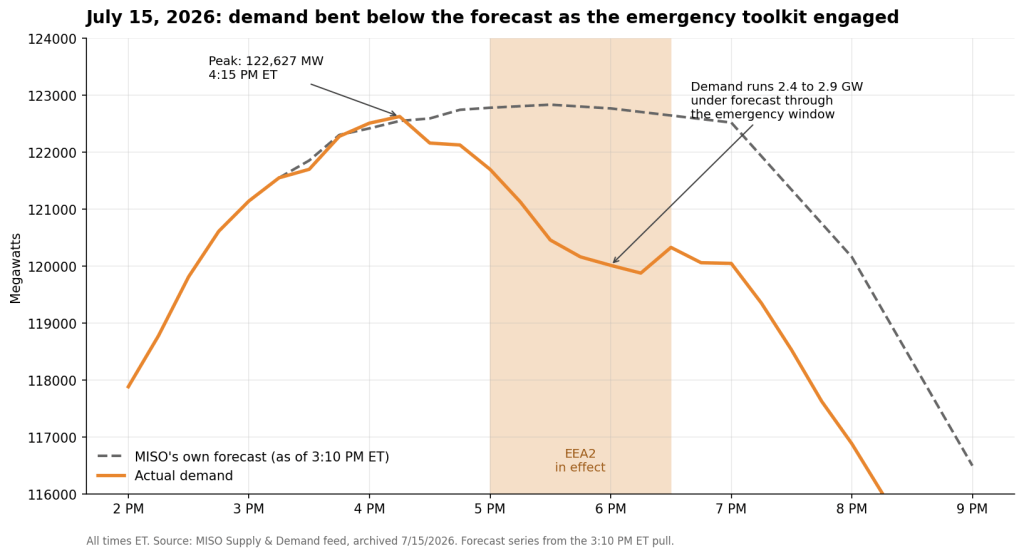
    Meanwhile, the demand side behaved differently than the official reasons might suggest. “Higher than forecasted load” appeared on every declaration that day. My archive shows that during the emergency window itself, the opposite was true. At 3:10 PM ET, MISO’s own intraday forecast projected demand of about 122,800 MW for the late afternoon. The actuals came in at 121,699 MW at 5:00 PM, 120,458 MW at 5:30, and 120,014 MW at 6:00. Through the whole EEA2 window, demand ran 2.4 to 2.9 gigawatts below the forecast.

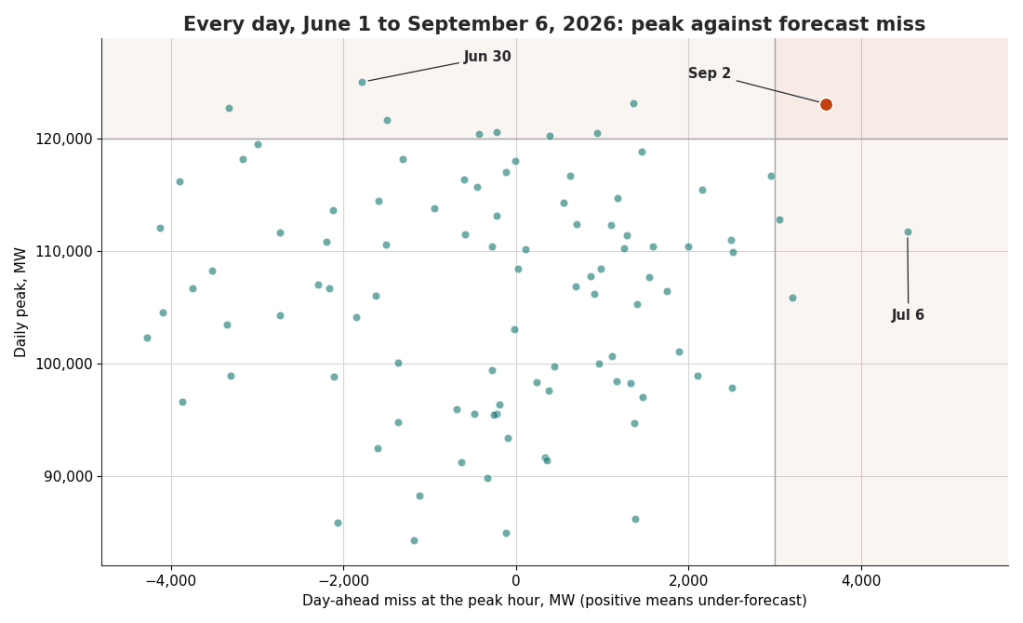
    I am not going to tell you what to conclude from the juxtaposition. Both things are in the record. The declarations cited forced outages first among their reasons, and the outage table shows why. The declarations also cited higher than forecasted load, and the load data shows demand undershooting the forecast throughout the emergency hours. Some of that undershoot is the emergency toolkit working, which is the next section. Some of it may be forecast conservatism on a dangerous day. The numbers are above; the reader can weigh them.

    MISO’s intraday forecast held near 122,800 MW through the emergency window. Actual demand fell 2.4 to 2.9 gigawatts below it as load modifying resources curtailed and thermostats eased upward. Source: MISO Supply and Demand feed, archived in real time on July 15; forecast series from the 3:10 PM ET pull.

    The machinery, working

    Three mechanisms carried the afternoon, and all three are visible in the data.

    The first was borrowing. MISO imported power from its neighbors all day, and by evening the net imports reached 16,854 megawatts, close to seventeen gigawatts, an extraordinary volume. The deepest borrowing came at the end of the day, after the emergency declarations had already terminated. The paperwork expired at 9:00 PM. The dependence did not.

    The second was commitment. Between 2:00 PM and 5:15 PM ET, the capacity MISO had committed and online rose from 126,783 MW to 135,308 MW. Eight and a half gigawatts added to the books in three hours, some of it those emergency operating ranges from the EEA1 declaration, some of it units racing to the field. You can watch the cavalry arrive in fifteen-minute intervals.

    The third was demand itself bending. That 2.4 to 2.9 gigawatt gap between forecast and actual during the EEA2 window is the fingerprint of load modifying resources curtailing on instruction and of ordinary people easing thermostats upward. MISO’s own after-action report, expected in the coming weeks, should put an official number on the load modifying resource deployment. I will return to it here when it posts.

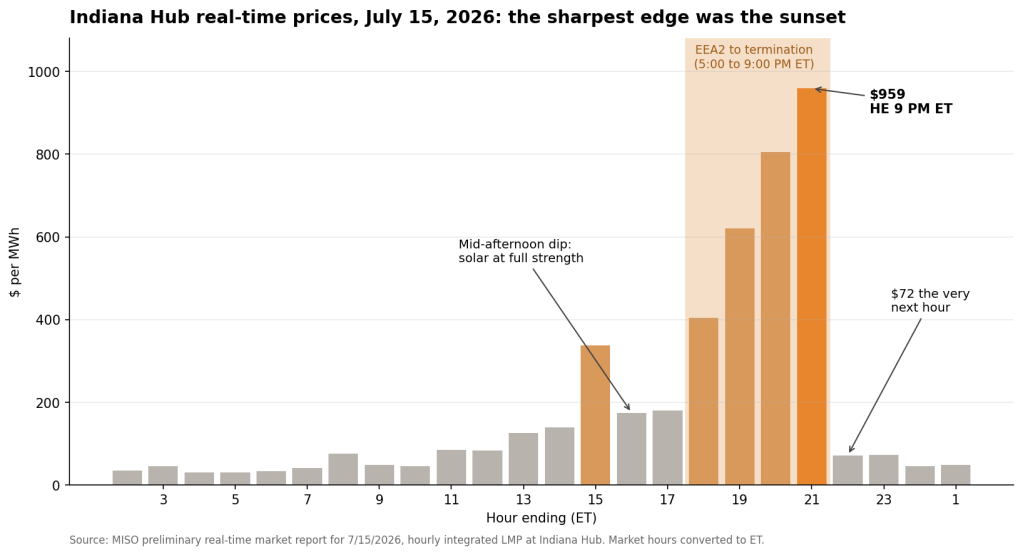
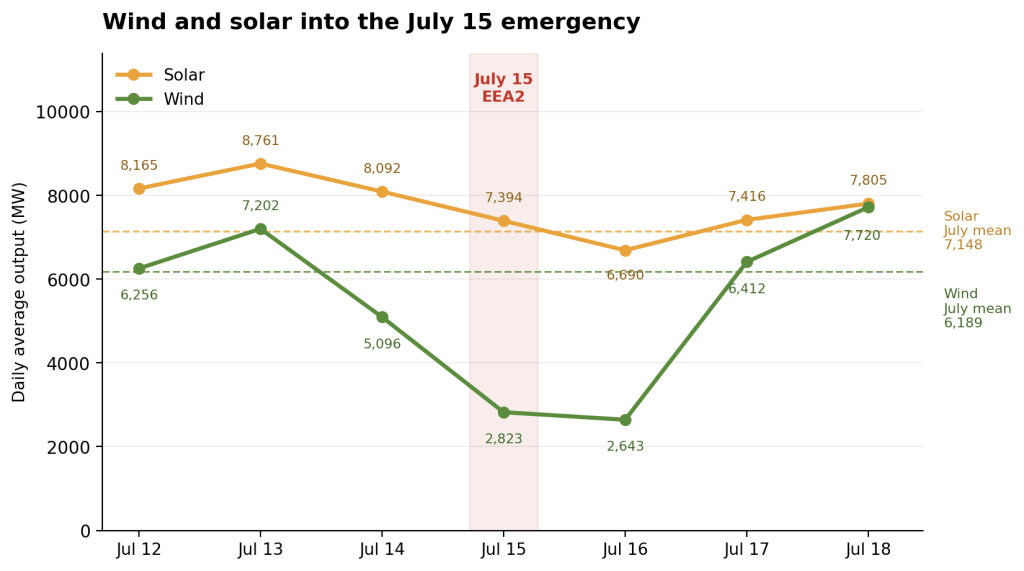
    And over all of it, prices told the day’s story with brutal clarity. Wholesale electricity in MISO is priced by locational marginal price, or LMP, the cost of serving one more megawatt at a given place and time. At Indiana Hub, the benchmark trading location, the hourly real-time price opened the day near $35, sat at $49 during breakfast, and climbed as the outage list grew: $125 by midday, $337 by early afternoon. Then something interesting happened. Prices fell back to about $175 in the very hours demand was cresting, because sixteen gigawatts of solar generation were pouring in at full strength. The emergency’s sharpest edge was never the demand peak. It was the sunset. As solar faded from 15,035 MW at 6:00 PM to 7,726 MW by 8:00 PM, with wind delivering only 1,700 to 1,900 MW all evening, the price staircase went vertical: $405, $620, $806, and finally $959 for the hour ending 9:00 PM ET. The hour after termination, it was $72. From nearly a thousand dollars to seventy-two in a single step. By the day’s final market hour, $49, almost exactly where it began.

    Hourly real-time prices at Indiana Hub, MISO’s benchmark trading location. The climb tracks the evening solar fade, not the afternoon demand peak, and the fall from $959 to $72 lands exactly at the 9:00 PM ET termination. Source: MISO’s preliminary real-time market report for July 15, 2026.

    How close was the real emergency?

    The question my neighbors asked, once they learned what I watch all day, was simple. Were we close to the lights going out?

    The honest answer has three layers.

    Procedurally, EEA3 is one rung up the ladder, but the distance is bigger than one rung suggests. Inside Step 2, MISO deployed load modifying resources and emergency purchases, but it never issued formal public appeals for conservation, never drew down its operating reserves, and never made the deeper reserve call on neighboring grids. Several tools stayed in the box. EEA3 is declared when the toolkit is exhausted, and on July 15 it was not close to exhausted.

    Physically, the question is what additional failure would have been required. Wind had little left to give, delivering under two gigawatts and missing even its own modest forecast. The realistic paths downward were another multi-gigawatt block of outages stacking onto the 15,453 MW already lost, or trouble on the far side of the border, because seventeen gigawatts of imports means seventeen gigawatts of dependence on neighbors having power to spare. The borrowing that saved the day is also, candidly, the day’s soberest number.

    Historically, the record is reassuring in a specific way. In the modern record, MISO has ordered firm load shed, the deliberate interruption of customers, exactly three times. Roughly 500 MW during Hurricane Laura in August 2020, for a Louisiana pocket wrecked by transmission damage. 700 MW at the depth of Winter Storm Uri in February 2021, in the South Region. And approximately 600 MW directed around New Orleans on May 25, 2025, per MISO’s own event report, with roughly 500 MW of it landing across the metro area. All three in the South. None in the Midwest core. None larger than 700 MW on a system serving over 120,000 MW.

    That last event carries a lesson worth separating out. New Orleans did not happen at the top of the capacity ladder. It happened through a different door entirely, a transmission security emergency, where an overloaded line threatens cascading failure and operators shed load with minutes of notice rather than hours. The capacity ladder is slow and announced. July 15 was a day spent partway up that staircase, with every step published in advance. The transmission door has no staircase. Understanding which door an emergency comes through is most of understanding how much warning you will get.

    The winter rehearsal

    Here is the part that convinced me this day deserved a full write-up rather than a thread. It had already happened once this year, in the cold.

    On January 24, during Winter Storm Fern, MISO declared EEA2 for the North and Central Regions, the same two regions, the same rung of the ladder, in the same year. The parallels are almost uncomfortable. Fern’s emergency was outage-driven too, with unplanned generation outages exceeding 40 gigawatts at their peak, the overwhelming share concentrated in the North and Central regions. Fern deployed about 2 gigawatts of load modifying resources, the same scale as July’s demand response. Fern leaned on emergency purchases from PJM, the neighboring grid to the east, just as July leaned on imports.

    And one difference makes the comparison sting. During Fern, a software failure kept emergency prices from publishing for roughly eleven hours. Prices on the screens did not reflect the emergency on the ground, which meant imports were never properly paid to show up. MISO shipped the fix on February 5. The clean, vicious price staircase of July 15, the one that pulled seventeen gigawatts across the borders and then collapsed the moment the emergency ended, was that fix passing its first summer exam. In January the price signal was broken. In July it worked. The whole difference between those two sentences is invisible to anyone whose lights stayed on, which is to say everyone, and it is one of the most consequential facts of the year on this grid.

    One year. Two seasons. Two EEA2s, same regions, same anatomy. The machine got tested in the cold, patched in February, and passed in the heat.

    What EEA3 would have looked like at your house

    Since the question deserves a concrete answer. If July 15 had gone one rung further, here is the sequence, for a reader in eastern Missouri.

    MISO computes the shortfall in megawatts and allocates a share to each local utility. Ameren receives a number. Ameren implements it through pre-engineered rotating outage plans: feeder-level blocks, typically rotating every 30 to 60 minutes so no neighborhood carries the whole burden, with circuits serving hospitals, water treatment, and emergency services flagged for exclusion where the network allows. Wholesale prices go to the Value of Lost Load, an administrative ceiling meant to represent what interrupted service actually costs. That ceiling is currently $10,000 per megawatt hour, effective September 30, 2025, nearly triple the $3,500 that applied during the Laura event. The financial deterrent got steeper between the last EEA3 and any future one, which was the point.

    And it is not hypothetical machinery. EEA3 has been declared twice on the capacity ladder in the modern record, and both declarations left a paper trail in MISO’s own emergency log. On August 27, 2020, as Hurricane Laura tore out transmission in western Louisiana, MISO declared EEA3 for the affected pocket with Value of Lost Load pricing in effect from 12:00 PM ET until nearly midnight. The log records 300 MW of load shed ordered at 1:02 PM ET, another 200 MW at 2:22 PM ET, and termination once transmission returned to service. On February 16, 2021, at the bottom of Winter Storm Uri, MISO declared EEA3 for the South Region at 7:40 PM ET and requested 700 MW of firm load shed ten minutes later. That declaration ran until 1:00 AM ET. In both cases, what customers experienced on the ground was the rotating-outage machinery described above, implemented by their local utilities, lasting hours rather than days, and lifted the moment conditions allowed.

    It is machinery. Rehearsed, bounded, and used briefly, and never here. That is not a promise. It is a base rate.

    The record, stated precisely

    Claims like “first” deserve receipts, so here are mine. Against MISO’s own compiled declaration log covering 2009 through mid-2024, and against the individual records for every season since, July 15, 2026 was the first NERC EEA2 declared during MISO’s June-through-August summer season in the modern record. It was declared for the North and Central Regions, not the full footprint. The honest footnotes: MISO reached the equivalent market step without a NERC EEA2 declaration on June 10, 2021 and August 24, 2023, and a South Region EEA2 occurred on September 15, 2018, summer by the calendar though outside MISO’s June-through-August planning season. The nearest EEA2 in time was not years ago. It was January.

    Summer capacity emergencies used to be a thing MISO wrote procedures about and winter storms delivered. As of this year, both seasons have produced one.

    Yellow, not green

    At 9:00 PM ET the declarations expired. My dashboard gauge did not go green. It went yellow, because Conservative Operations remained in effect through the end of the week, and out at the borders the imports were still running at their daily maximum after the emergency ended. The paperwork closed. The posture did not.

    In the series that started with my electric bill, I argued that the margins on this grid are thinning, and that the interesting question is not whether the emergency toolkit works. July 15 is what a thinning margin looks like when the toolkit works: four large power plants’ worth of supply vanishing from the ledger between breakfast and mid-afternoon, absorbed by borrowing, commitment, demand response, and a price signal doing exactly what it was built to do, ending seventy-two minutes ahead of schedule with nobody’s lights out.

    The toolkit worked in January. It worked in July. The question the data cannot answer, and the one worth sitting with, is how many times in a row it has to.

    Fediverse Reactions
  • Why Every Power Supply in Your House Says “100–240V” (A Story About Japan)

    Why Every Power Supply in Your House Says “100–240V” (A Story About Japan)

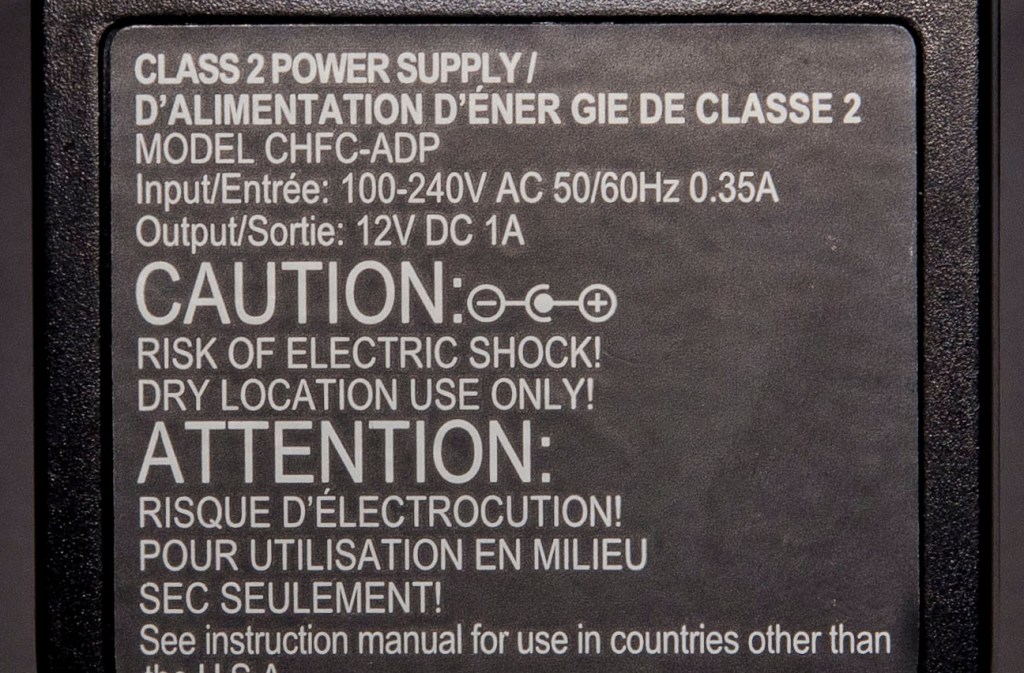
    I was getting ready for an upcoming trip to Switzerland and Italy, and I picked up the power brick for my laptop to check whether it would handle European voltage. The label said INPUT: 100–240V, which is exactly what I wanted to see. I can plug it in over there with just a plug adapter, no transformer needed.

    But then I stopped and looked at that number again. 100 volts. Who runs on 100 volts? The U.S. runs on 110 to 120. Europe runs on 220 to 240. Most of the world is in one of those two camps. So why does basically every power brick I own, including phone chargers, laptop supplies, and electric toothbrushes, quote a range that starts at 100 instead of 110?

    I went down the rabbit hole. The answer turned out to be one of the best pieces of accidental history I’ve ever stumbled into. So this week, we’re taking a break from my electric bill to talk about Japan.

    The country that runs on 100 volts

    Japan is the only major country in the world where household power is nominally 100 volts. Not 110, not 120, not 220. One hundred. Everyone else clusters around either the North American standard (110 to 120V) or the European/Australian standard (220 to 240V). Japan sits by itself.

    And the reason is essentially two separate stories of inertia that converged into one strange national outcome. Two competing electric companies, in two different Japanese cities, bought their first generators from two different countries within about a year of each other in the mid-1890s. Nobody coordinated. Nobody planned. And once the decisions were made, it was too expensive to undo any of it.

    But it gets weirder. Japan didn’t just end up with a unique voltage. It ended up with two incompatible electrical grids inside the same country, and the country still can’t fully share power between them today. That’s the part that really got me.

    Meiji-era Japan was buying everything from everyone

    To understand how this happened, you have to know what Japan looked like in the 1890s. The Meiji Restoration had ended a couple of decades earlier, and Japan was in the middle of an extraordinary national project to modernize. They had spent more than 200 years deliberately sealed off from most of the outside world, and now they were trying to catch up to the industrial West in a single generation. The strategy was straightforward: figure out who was best at each thing, buy their stuff, and learn from it. Naval architecture from the British. Army organization from the Prussians, then the French. Medicine from the Germans. Universities patterned on the American and European models.

    Electricity was brand new. Edison’s first commercial power station in New York had opened in 1882. By the 1890s the technology was spreading fast, but there were no international standards. Different manufacturers in different countries had settled on different frequencies, the rate at which alternating current cycles back and forth, and there was no reason to think any of it mattered yet.

    So when Japanese cities started electrifying, they did what Meiji Japan did with everything else: they shopped around.

    1895 and 1896: two cities, two suppliers

    In 1895, the Tokyo Electric Light Company bought its first alternating-current generators from AEG, a German firm that was one of the giants of European electrical engineering at the time. Those generators ran at 50 hertz, the German standard.

    The next year, in 1896, the Osaka Electric Light Company bought its first generators from General Electric in the United States. Those ran at 60 hertz, the American standard.

    Tokyo and Osaka are about 500 kilometers apart. In 1896, the grids were tiny, local, and isolated. Each one served the immediate area around a single city. The idea that they would someday need to talk to each other, that there might eventually be a single national grid stretching the length of Japan, was not on anyone’s mind. Why would it be? Electric service barely reached the edge of town.

    A quick note on the voltage

    You might be wondering: if the German and American generators ran at different frequencies, did they also force the voltage difference? They didn’t. Voltage and frequency are independent properties of a generator, set by different design choices. The voltage story is separate, and it’s the less dramatic one.

    Early electrical equipment everywhere in the world ran at relatively low voltages in the 1890s, typically around 100 to 110 volts, because that’s what Edison-era bulbs and motors were built for. The U.S. started there too. The difference is what happened next. Over the following century, the United States gradually crept up to 120 volts to reduce line losses as appliances grew more demanding. Europe pushed all the way up to 220 to 240. Japan didn’t. They started at 100 and stayed at 100.

    The mid-20th-century Japanese government actually did consider raising the voltage closer to European levels. They decided not to. By that point too many homes, factories, transformers, motors, and appliances had already standardized on 100 volts. Replacing all of it nationwide was going to cost more than living with it. So they didn’t.

    That’s why Japan is stuck at 100 volts. Not because of a 19th-century accident, but because of a 20th-century cost-benefit decision that said the accident wasn’t worth fixing.

    The frequency split, on the other hand, is the 19th-century accident. And it gets worse over time, not better.

    The grids grew until they ran into each other

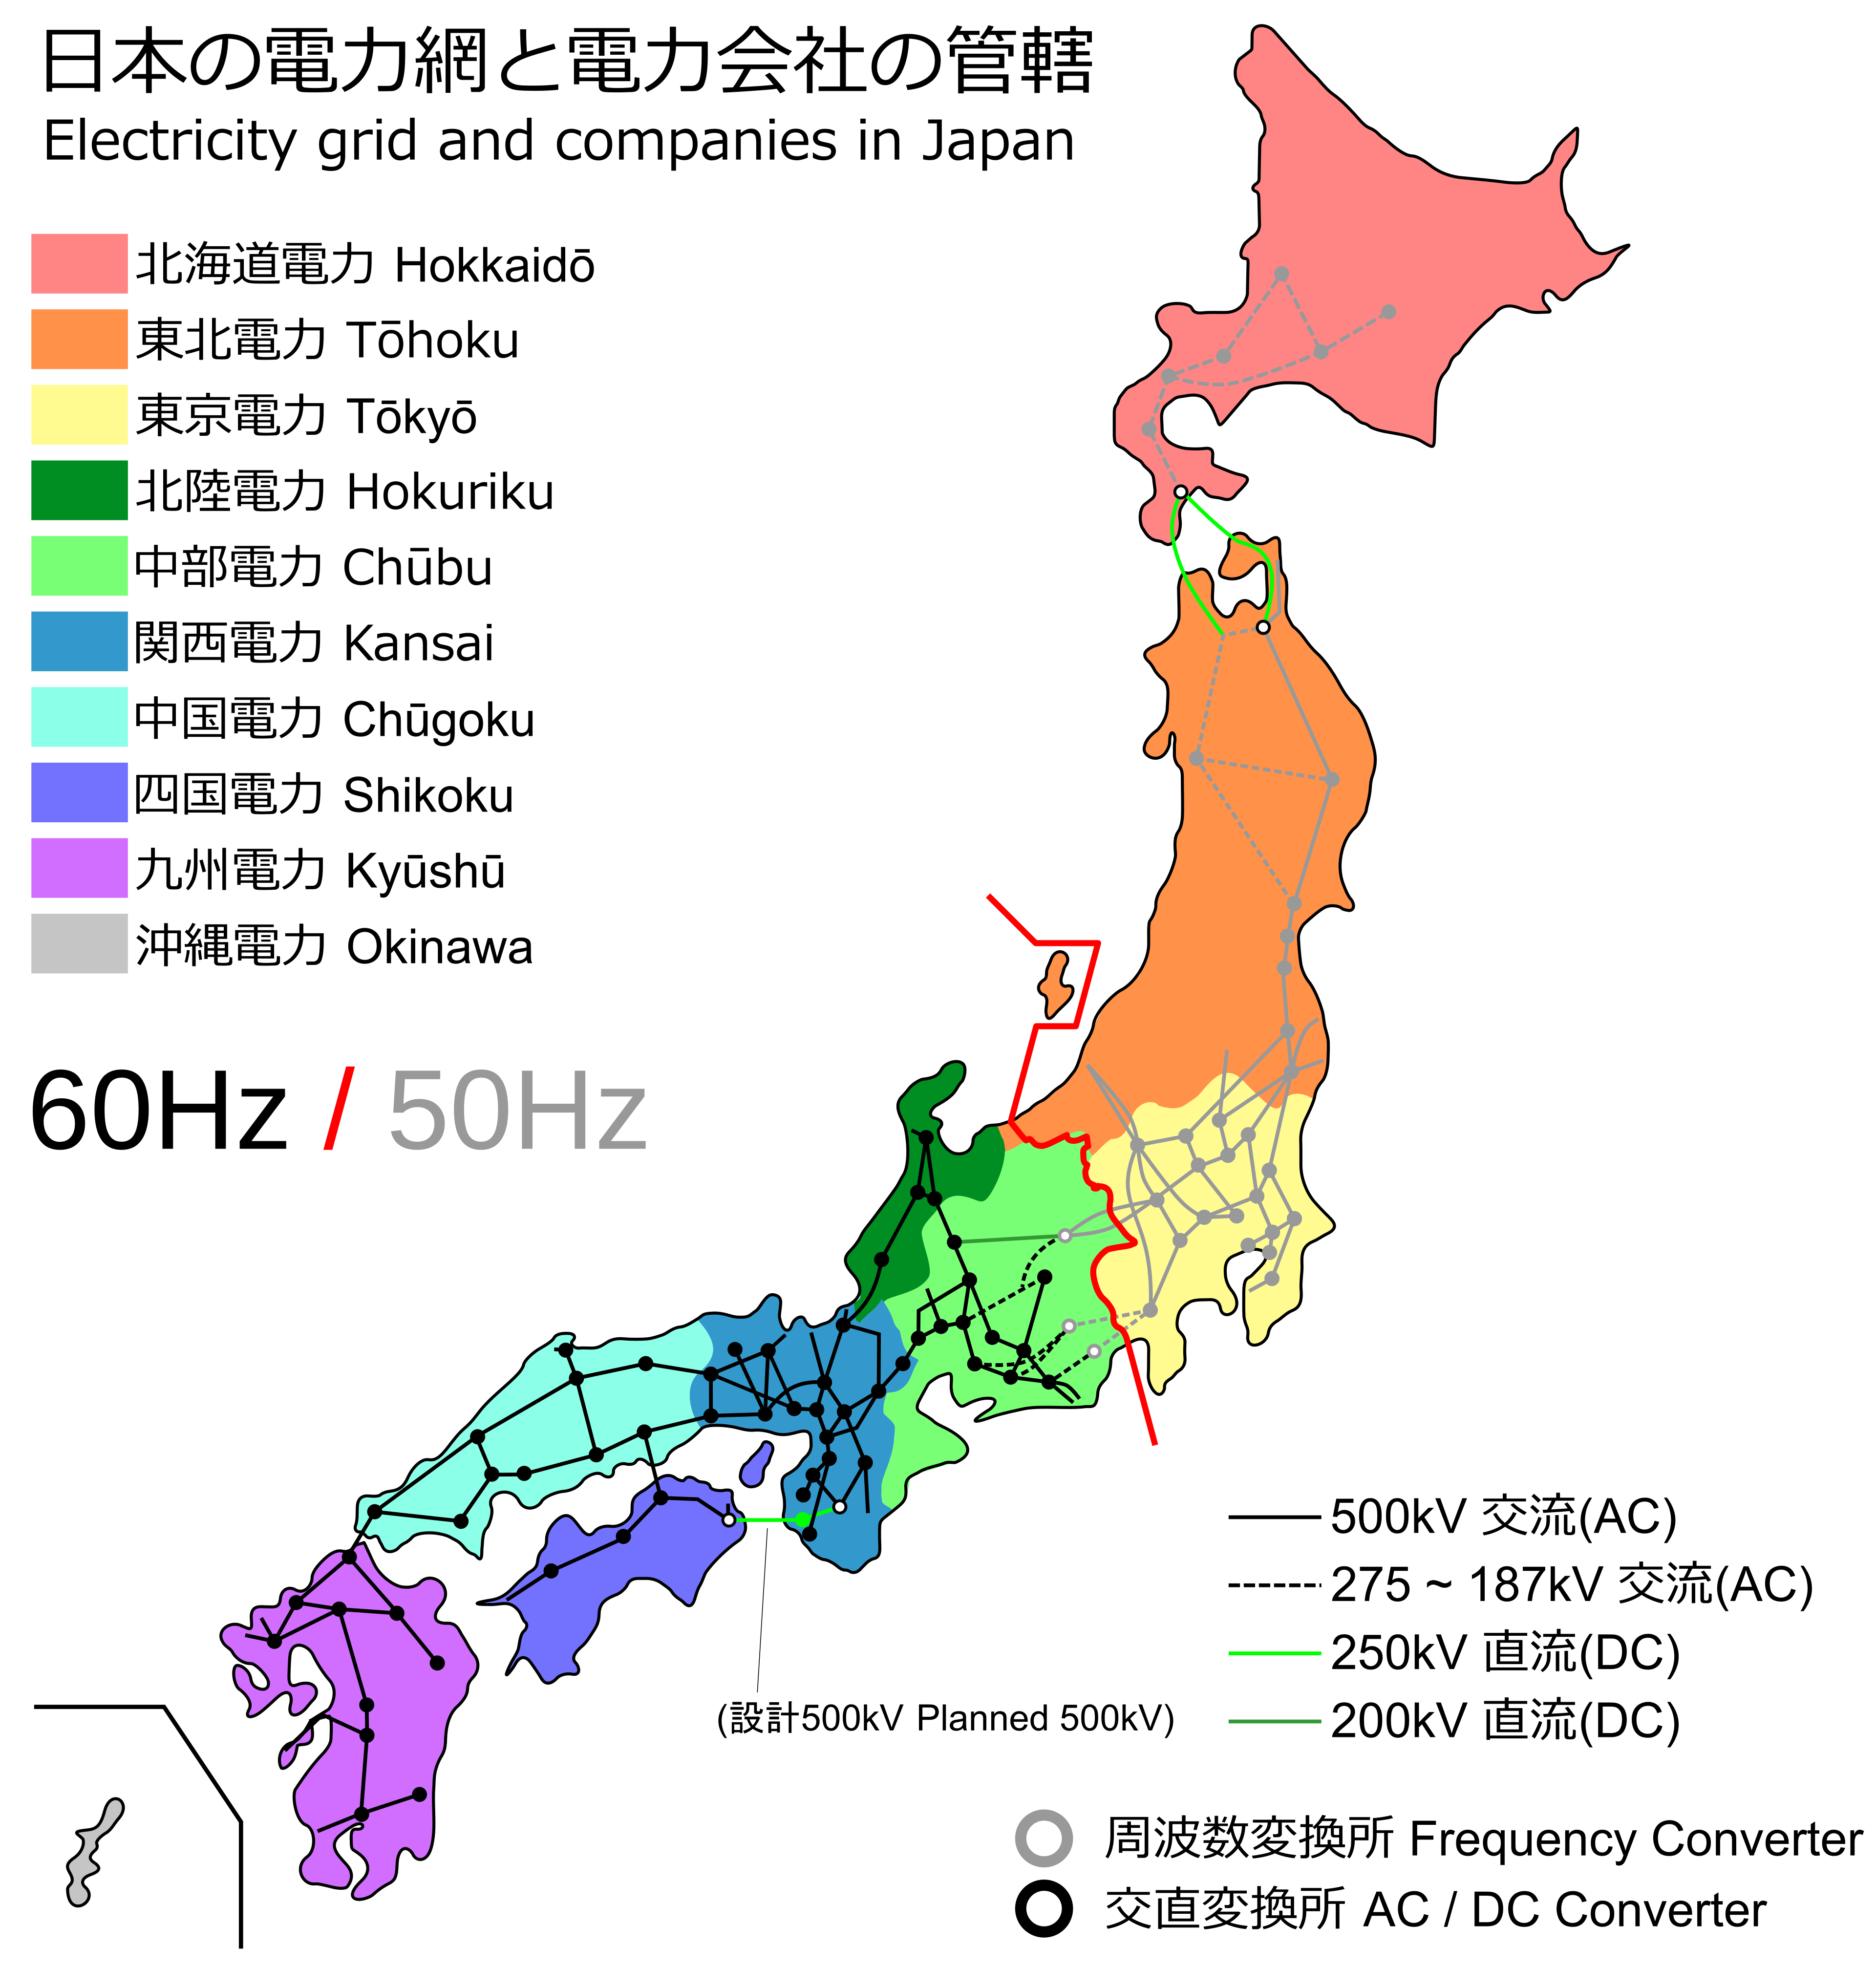
    Over the next few decades, electricity spread across Japan. Tokyo’s 50-hertz grid expanded eastward and northward, eventually covering Hokkaido, Tohoku, the Kanto region, and parts of central Honshu. Osaka’s 60-hertz grid spread west and south, covering Kansai, Chugoku, Shikoku, and Kyushu. By the 1920s, surveys showed that around 83 percent of the Tokyo region was on 50 Hz and 87 percent of the Osaka-Nagoya region was on 60 Hz. The two systems were no longer isolated city grids. They were regional power networks. And they were heading toward each other.

    The boundary they eventually settled on runs roughly along the Fujigawa River in Shizuoka Prefecture, up through Itoigawa City in Niigata Prefecture. Cross that line and the frequency changes. Everything east of it is 50 Hz. Everything west is 60 Hz. A microwave you bought in Tokyo might not work properly in Osaka, and vice versa, depending on the model.

    Map of Japan showing the 50 hertz and 60 hertz electrical grid regions, with the red boundary line running through central Honshu along the Fujigawa River in Shizuoka Prefecture and Itoigawa City in Niigata Prefecture.
    Japan’s electrical frequency split. Eastern Japan runs at 50 Hz; western Japan runs at 60 Hz. The red line marks the boundary. Map via Wikimedia Commons.

    Japan is, as far as I can tell, the only country on the planet running two incompatible electrical frequencies inside its own borders. And just like with the voltage, the mid-20th-century government considered unifying the country on a single frequency and decided the cost was prohibitive. So they didn’t.

    The bill from 1896 came due in 2011

    For most of the 20th century, the frequency split was an inconvenience but not a crisis. The two halves of the country were connected by a small number of frequency converter stations, facilities that take AC power off one grid, convert it to DC, and then synthesize a new AC waveform at the other frequency to push it onto the other grid. There are only a handful of these stations. Their combined capacity is limited. For decades, that was good enough.

    Then in March 2011, the Great East Japan Earthquake hit. The Fukushima Daiichi nuclear plant was destroyed. TEPCO, Tokyo’s utility, lost a huge chunk of its generating capacity overnight, right at the moment Tokyo needed electricity most. And the painful realization sank in: more than half of Japan’s total generating capacity was sitting on the other side of the frequency line, in the west, and there was no way to move enough of it east.

    The converter stations could push around 1.2 gigawatts across the boundary in total. TEPCO needed multiples of that. The west had power to spare. The east couldn’t get to it. Tokyo went through rolling blackouts.

    That moment, more than any other, made it clear that a decision two electric companies made in 1895 and 1896, without coordinating, without thinking about national infrastructure, without any reason to imagine the grids would ever meet, was still constraining Japan more than 115 years later.

    They’re still paying for it

    The response to 2011 included a national push to build more converter capacity, and that work is still happening right now. In October 2023, Mitsubishi Electric was awarded a contract to supply a new 300-megawatt HVDC frequency converter at the Shin-Sakuma station in Hamamatsu, Shizuoka. The system is expected to enter service by the end of March 2028. That’s a 130-year-old decision still generating engineering contracts and capital expenditures in the 2020s.

    I find that detail genuinely hard to absorb. Two procurement decisions made by separate companies in separate cities in 1895 and 1896, neither one of which had any idea the other was happening, neither one of which was thinking past the next few city blocks, are still costing Japan money and constraining Japan’s grid in 2026. The decisions weren’t reversed. They couldn’t be reversed. The country just adapted around them, and is still adapting.

    What this has to do with your phone charger

    Here’s the punchline. Modern electronics use switching power supplies, the little bricks at the end of every cable, that can accept a wide range of input voltages. That’s why they work in different countries. But the specific range on the label, 100 to 240V, was not chosen arbitrarily.

    The top end, 240V, is there to cover Europe, Australia, the UK, and most of Asia. The bottom end, 100V, is there for one country. Japan. If Japan ran on 110V like the United States, the standard label on every charger in the world would say 110 to 240V instead, and manufacturers would have a slightly easier time of it. But they don’t. They have to cover Tokyo and Osaka too. So the universal input range starts at 100.

    Every Apple charger. Every Dell laptop brick (including the one I was looking at). Your electric toothbrush. Your phone. Pick one up and look at the back. It almost certainly says 100–240V, and that lower bound exists because Japan chose, in the mid-20th century, that fixing the accidental decisions of the 1890s would cost more than living with them.

    The whole world’s electronics carry a small fingerprint of 19th-century Meiji-era Japan, baked into the label on every power brick. Most of us have looked at that number a thousand times and never wondered why it was 100 instead of 110.

    I picked up my laptop’s power brick to figure out I could take it to Europe. Turns out I also learned why my microwave wouldn’t work in Tokyo.


    Next week: a story I’ve been wanting to tell for a while about a small black box on my home network called a Pi-hole, and what it’s done to my view of how the internet actually works.

    Fediverse Reactions
  • Why AI Might Not Get the Power It Needs

    Why AI Might Not Get the Power It Needs

    Part 3 of a series on what I learned by accident when I started paying attention to my electricity bill.


    In Post 2, I wrote about the grid as a precision-balanced machine and ended with the Virginia 2024 incident, in which sixty data centers disconnected themselves from the grid in milliseconds because of a routine equipment fault, dumping 1,500 megawatts of load that the system had to scramble to absorb. I said the event was a preview of something larger that’s already underway.

    This post is about that something larger.

    The thing I want to convey here is hard to convey because the scale is genuinely difficult to grasp. The AI buildout that’s happening right now, in 2026, is not an evolution of the previous data center industry. It’s a different category of thing, growing at a different rate, with different operational characteristics, and the existing grid was not built for it. Neither were the rules governing it.

    I am going to try to explain how big this is, why the grid can’t keep up with it, what the companies building it are doing in response, and why none of the official solutions are likely to work in time.

    The size of the thing

    The previous generation of data centers, the ones that hosted your email and your cloud storage and your video streaming, drew power in the tens of megawatts. A typical large data center campus, in 2018, might have pulled 40 to 80 megawatts. That was a substantial customer for a regional utility but not a transformative one.

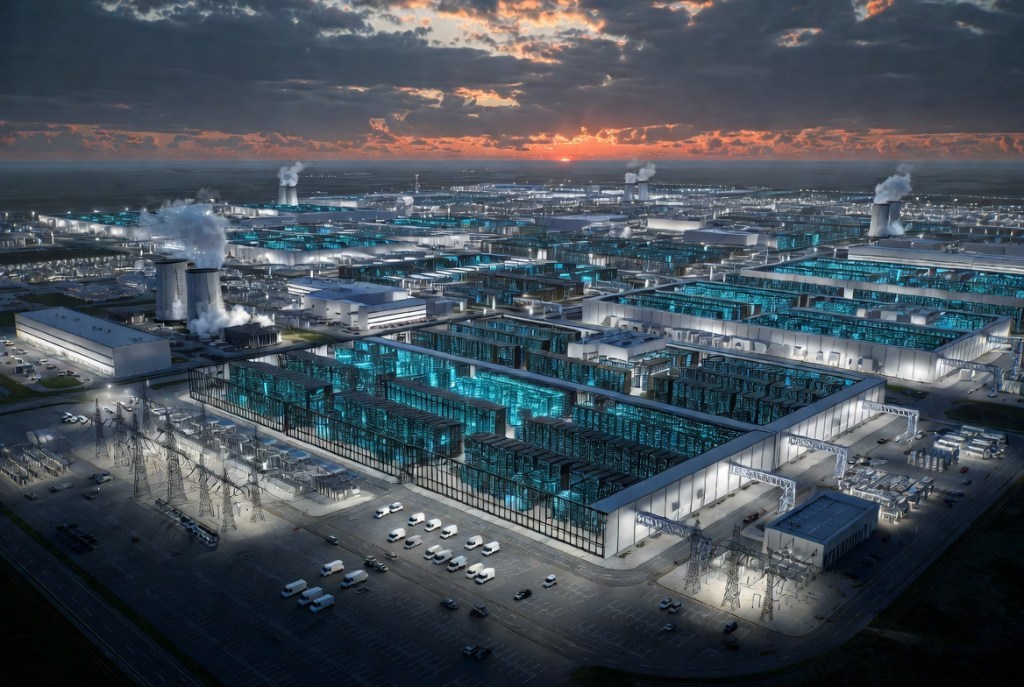
    AI training data centers operate at a different order of magnitude. A single hyperscale AI campus today is being designed for one to two gigawatts of power draw. Plural gigawatts. That is, one to two thousand megawatts per campus. Per campus.

    To put a single gigawatt in context: it is roughly the power output of a large nuclear reactor. It is also roughly the average power consumption of a city of half a million people. When a hyperscaler builds a one-gigawatt AI training facility, they are building, from the grid’s perspective, the equivalent of dropping a small city onto the system, in one location, all at once.

    And they are not building one campus. Microsoft, Google, Amazon, Meta, and Oracle are each building multiple multi-gigawatt campuses, simultaneously, across multiple states. Then there are the OpenAI and xAI and CoreWeave and other dedicated AI infrastructure companies doing the same. And the regional utilities, all of them, are receiving interconnection requests for these campuses faster than they can process them.

    Projections of how much electricity AI will consume by 2030 vary, but the credible range is roughly 300 to 500 terawatt-hours of new annual demand in the United States alone. The lower end of that range is bigger than the entire electricity consumption of California. The higher end is bigger than the entire electricity consumption of Germany. Either way, what we are talking about is adding the equivalent of one of the largest power-consuming economies in the world to the existing U.S. grid, in five years.

    This was not in any utility’s planning model as recently as 2022.

    The queue that never empties

    When a new generation project or a new large customer wants to connect to the grid, they don’t just plug in. They enter what’s called an interconnection queue. The utility studies whether the existing transmission system can handle the new connection, identifies necessary upgrades, calculates who pays for what, and eventually issues the agreements that allow the connection to proceed.

    This process has always taken time. But the data published by Lawrence Berkeley National Laboratory, which tracks the U.S. interconnection queue, shows that it has stopped functioning at the scale it now needs to operate. The current queue contains over two thousand three hundred gigawatts of proposed projects. That is roughly double the entire installed generation capacity of the United States. The queue contains, in proposed form, a second United States grid.

    But the queue does not turn proposals into operating projects. Of all the projects that entered the queue between 2000 and 2019, only about thirteen percent had reached commercial operation by the end of 2024. The rest were withdrawn, cancelled, or still waiting after years of review.

    Even projects that do get built spend an average of about five years in the queue before they begin operating. That number has been getting worse, not better, over the past fifteen years.

    For a hyperscaler trying to build a data center that needs to be operational in 18 to 24 months, this is a structural impossibility. The grid expansion that would be required to serve them, on the timeline the regulated utility process can deliver, cannot happen in time. By the time the utility finishes the studies, files the rate cases, builds the new transmission line, and energizes the new substation, the data center has already been operating, or has already been abandoned.

    So the hyperscalers stopped waiting.

    Bring your own power

    Sometime between late 2024 and early 2026, the hyperscaler industry made a strategic pivot that did not get much press coverage but is going to reshape American electricity infrastructure. They decided to stop relying on the public grid to power their AI data centers.

    This is referred to in the industry as “behind-the-meter generation” or “bring your own power.” What it means in practice is that the hyperscaler builds its own dedicated power generation, on or adjacent to the data center site, and uses that generation as the primary power source. The grid connection becomes a backup, not the primary supply.

    The scale of this pivot is remarkable. As of late 2025, industry trackers were following approximately forty gigawatts of announced behind-the-meter generation tied to specific data center projects. To repeat: that is forty thousand megawatts of dedicated power plants, mostly natural gas, being built outside the regulated utility planning process, on private timelines, by companies that are not in the power business and have never operated power infrastructure at scale.

    The poster child for this strategy is xAI’s Colossus facility in Memphis, which Elon Musk built and brought online faster than any data center of comparable size in American history by deploying dozens of portable natural gas turbines on site, in many cases before the permits to operate them had been granted. The local air quality district and the Tennessee state environmental regulators have been playing catch-up ever since. Fines have been issued. Operations have continued.

    The point is not that Musk is uniquely cavalier, although he might be. The point is that the economic logic of the AI buildout makes regulatory delays unacceptable to the companies building it. A hyperscaler that waits two years for permits while a competitor builds in six months loses the AI race. The decision tree is not really a tree at all. It is a single branch: build now, deal with consequences later. Pay the fines. Settle the lawsuits. Keep the data center running.

    If you are a regulated utility trying to integrate this customer into your service territory, you are not actually negotiating with a customer. You are watching a customer build their own utility, on their own timeline, and asking you to please connect a backup line when you can.

    The rules that don’t exist yet

    The Virginia 2024 incident I wrote about in Post 2, in which sixty data centers disconnected in milliseconds, was not an isolated event. The North American Electric Reliability Corporation, NERC, has identified multiple similar incidents in both the Eastern Interconnection and the Texas grid since 2022. In each case, large computational loads have unexpectedly disconnected, in coordinated waves, in response to disturbances that the grid would normally have absorbed without incident.

    In September 2025, NERC issued a Level 2 alert about this. A Level 2 alert is a regulatory step below an emergency, asking the industry to develop better practices for handling large computational loads. The response from the industry was, by NERC’s own assessment, inadequate. Most of the entities NERC asked to develop better practices did not develop better practices.

    So on May 4, 2026, just two weeks ago, NERC escalated to a Level 3 alert. A Level 3 is the highest level of alert NERC issues. It identifies “essential actions” that grid operators and transmission planners must take to address an immediate reliability risk. NERC has not issued a Level 3 alert about large loads before. The previous Level 3 alert, issued in 2024, was about a different concern entirely, the behavior of solar and wind resources during grid disturbances.

    The current alert reflects a regulatory body that has run out of patience with the pace of industry response. NERC’s modeling, published earlier this year, indicates that the coordinated disconnection of two thousand megawatts of data center load, which is well within the operational range of a single hyperscale campus, could destabilize twenty percent of the Eastern Interconnection. That would be a blackout on the same scale as 2003.

    But here is the part that I find genuinely difficult to absorb. The Level 3 alert does not actually require data centers to do anything differently. It requires transmission planners and grid operators to study the problem, model the risks, and report back. The deadline for the initial response is August 3, 2026. The data center operators themselves are not directly bound by the alert at all.

    The reason for this regulatory gap is structural. NERC’s mandatory reliability standards apply to entities classified as part of the Bulk Electric System, which historically has meant generators and transmission operators. Data centers, even gigawatt-class ones, are classified as customers. They are bound by their interconnection agreements with their local utility, but they are not subject to the same mandatory federal reliability standards that govern, say, a nuclear power plant or a regional transmission organization.

    NERC is working on changing this. There is a process underway to create a new classification called a Computational Load Entity, which would subject large data centers to mandatory reliability standards. The estimated timeline for that process, according to industry analysts working on it, is somewhere between three and five years.

    In the meantime, data centers continue to interconnect at the pace of new construction, under existing rules, with the kind of internal protection systems that produced the Virginia 2024 incident, on an honor system that depends on the data center operator picking up the phone when the grid operator calls.

    The honor system problem

    I want to spend a moment on this, because when I learned how the current coordination between data centers and grid operators actually works, I was genuinely surprised.

    When a major grid disturbance happens and data centers trip themselves offline to backup power, the process of bringing them back online has to be staggered. If sixty data centers all reconnected to the grid simultaneously, you would create the opposite problem from the disconnection, an instantaneous fifteen-hundred-megawatt load step that the grid would have to absorb in the other direction.

    The way this is currently managed is largely by phone call. The grid operator’s control room calls the data center operations centers. They coordinate a staggered reconnection. The data centers cooperate.

    There is no technical mechanism that prevents a data center from reconnecting whenever it wants. The automatic transfer switches that physically reconnect the facility to the grid are owned and controlled by the data center, not the utility. The utility could, in an extreme case, manually open the breaker on its side of the connection, but this is a last-resort action, not an automated safety system.

    The entire system depends on the data center operator choosing to cooperate. Which has worked so far, because the operators involved have been hyperscalers with sophisticated operations teams who understand the consequences of uncoordinated reconnection and have working relationships with their grid operators. But it depends on goodwill, scaled, in an industry where the willingness to pay fines as a cost of operating quickly is a documented business strategy.

    A senior grid planner I read recently put it bluntly: the current arrangement works because the number of relevant data center operators is small enough to coordinate by phone. As that number grows, and as the diversity of operators grows beyond a handful of hyperscalers to include hundreds of smaller AI startups, colocation providers, and crypto miners, the assumption that everyone will cooperate becomes thinner.

    The collision

    So here is where we are.

    The AI industry is building data center capacity that will dwarf any new demand source the U.S. grid has absorbed in its entire history. The companies building it are doing so on private timelines, with private generation, often outside the regulated planning process, in many cases without waiting for the permits that would normally be required. The regulatory body responsible for grid reliability has acknowledged that current rules are inadequate but cannot create new rules faster than the buildout proceeds. The technical coordination between data centers and the grid is governed largely by phone calls and cooperative agreements that depend on goodwill.

    This is the operating condition of American electricity infrastructure right now. Not a future scenario. The current reality.

    The grid will not collapse next week. The grid is more resilient than this description might suggest, because of the decades of engineering and regulatory effort that went into making it resilient. But the margin of safety that grid planners used to be able to count on is shrinking, fast, and the people responsible for managing the system are publicly acknowledging that they cannot keep up with the pace of change.

    In the final post in this series, I want to bring all of this back to where we started. What does any of this mean for someone like me, a residential customer in Missouri running a dishwasher at ten PM? What is going to happen to my electric bill, and to yours? And what, if anything, can ordinary ratepayers actually do about it?

    That’s next week.


    Next Sunday: Why Your Electric Bill Is About to Get Weirder. What the AI buildout means for the rest of us, and what we can actually do.

  • The Grid Behind the Grid

    The Grid Behind the Grid

    Part 2 of a series on what I learned by accident when I started paying attention to my electricity bill.


    After Post 1 went up, the question I couldn’t stop turning over was this: if the 10 PM cutoff on my Ameren bill maps to actual physics on a continental-scale grid, then what does that grid actually look like? Not in a metaphorical sense. Mechanically. What is the thing on the other side of my wall outlet, and how does it stay running?

    I went looking, and the answer turned out to be more remarkable than I expected, and also more fragile than I expected. By the end of what I learned, I had stopped thinking of the grid as a robust piece of infrastructure that occasionally fails, and started thinking of it as something closer to a precision-balanced machine that succeeds every day for reasons that aren’t obvious until you understand them.

    This post is about that machine. It’s also about the time it almost broke, what we did to prevent that from happening again, and why something very similar is now happening on purpose, at scale, in ways that the people building it may not fully appreciate.

    A bicycle, going exactly ten miles per hour

    The single most useful way I’ve found to think about how the grid works is this:

    Imagine you’re riding a bicycle, and someone tells you that you must maintain exactly 10 miles per hour. Not 9.99, not 10.01. Exactly 10. Forever. The route ahead has hills you can’t see coming. When the road slopes up, you have to pedal harder. When it slopes down, you have to ease off, or maybe even brake. And if at any point you drift more than half a percent off speed, the bicycle disintegrates.

    That’s the grid.

    The “speed” in this metaphor is frequency. In North America, the grid runs at 60 cycles per second, also written as 60 Hz. Every generator on the grid spins at exactly this frequency, all the time. The frequency is the speed of the bicycle, and it has to stay locked at 60 Hz the way the bike has to stay locked at 10 mph.

    What makes this difficult is the hills, which are changes in demand. Every time someone turns on an air conditioner, opens a refrigerator, or starts a dishwasher, the grid encounters an uphill. The bicycle has to pedal harder. Every time someone turns off a load, the grid encounters a downhill, and has to ease off. And all of this is happening continuously, across millions of customers, every second.

    Grid operators tolerate about ±0.05 Hz of deviation from 60 Hz before they start getting nervous. That’s about 0.08% off speed. If the frequency drifts beyond roughly ±0.5 Hz, less than 1% off, protective equipment starts tripping generators offline to keep them from damaging themselves. That’s the bicycle disintegrating. Once a few generators trip, the remaining ones have to carry their load, which usually pushes frequency further out of bounds, which trips more generators. The cascade can run faster than anyone can intervene.

    So the bicycle has to stay at exactly 10 mph, on terrain it can’t see, with a margin of error under one percent, or it falls apart.

    Now imagine the bicycle is the size of a continent.

    Half a continent, in perfect sync

    The grid I’m part of, here in Missouri, is connected to a synchronous network called the Eastern Interconnection. It covers everything from the Rocky Mountains east to the Atlantic, plus most of eastern Canada. Roughly 39 states and 5 Canadian provinces.

    Every generator in that footprint, from a nuclear plant in Florida, to a coal plant in Ohio, to a wind turbine in Manitoba, to the natural gas plant down the road from my house, is spinning at exactly the same frequency, in exactly the same phase, every second of every day.

    That sentence took me a while to absorb when I first read it. Not approximately the same frequency. Not averaged over a minute. Right now, this exact second, hundreds of thousands of rotating machines spread across thousands of miles are all turning together in perfect synchronization. If they fell out of sync, the system would tear itself apart in seconds.

    This is achieved through what’s called synchronous coupling. When a generator is connected to the grid, the grid itself acts like a giant flywheel pulling it into line. A generator trying to speed up gets resisted by the inertia of every other generator. A generator trying to slow down gets pulled back by them. All those spinning turbines are mechanically locked together, by electromagnetism, into a single coordinated machine the size of half a continent.

    That machine is what we mean when we say “the grid.” Not the wires. The wires are just the connections between the rotating parts of the bigger machine.

    The thing that coordinates the bicycle

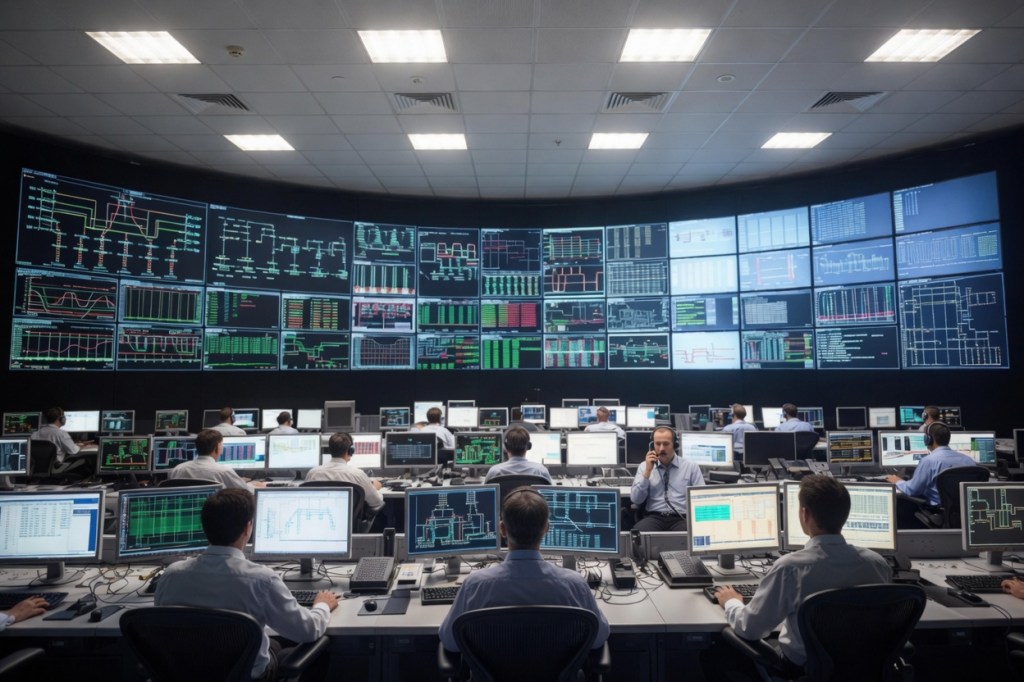
    Coordinating this machine in real time is the job of regional grid operators. The one that handles my electricity is called MISO, the Midcontinent Independent System Operator. MISO doesn’t own generators or transmission lines. It’s a coordinator, a market operator, and a referee.

    What MISO does, in simplified terms, is run an auction. Every five minutes, MISO collects bids from generators across its footprint, fifteen states’ worth of them, and figures out the cheapest mix of plants to run to meet projected demand for the next five minutes. The cheapest generation wins. That coal plant in Illinois, that wind farm in Iowa, that gas plant in Louisiana, all bidding into a single market that picks the lowest-cost combination.

    Underneath that five-minute market is something faster and more nervous. Every four seconds, MISO sends signals to specific generators telling them to ramp up or down a little, to keep the system frequency locked at 60 Hz. This is called Automatic Generation Control, and it’s how the bicycle stays at exactly 10 mph in real time. If frequency starts drifting up, MISO tells some generators to ease off. If it drifts down, MISO tells others to push harder.

    And underneath that, faster still, is the inertia of the machines themselves. When a sudden change hits the grid, the spinning mass of every connected generator absorbs the shock automatically, for the first few seconds, before any human or computer can react. That stored kinetic energy is what gives operators time to respond at all.

    So the grid is layered. Spinning inertia handles the millisecond response. AGC handles the four-second response. The five-minute market handles the minute-to-minute economic dispatch. Human operators handle the longer-term decisions about which plants to bring online or shut down across hours and days.

    It works, almost all of the time. But not always.

    The seven seconds it almost all came apart

    On August 14, 2003, a transmission line in northern Ohio sagged in the heat of an afternoon and touched a tree. That single point of contact tripped the line offline. On most days, that’s a routine event. The grid is designed to handle the loss of any single component without cascading failure.

    But on this particular day, the monitoring software at FirstEnergy, the Ohio utility responsible for that section of grid, had crashed. Operators didn’t know the line had failed. They didn’t take corrective action. Power that had been flowing on the tripped line had to find another path, so it flowed onto adjacent lines, overloading them, until they tripped too. Now more lines were down, and the remaining ones had to carry even more power, until they tripped, until a 3,500 megawatt power surge slammed across the regional grid in a direction operators hadn’t planned for.

    What happened next is one of the strangest and most important things I learned in all of this.

    The grid didn’t fail because it ran out of electricity. There was plenty of generation. What collapsed was something more subtle. As lines tripped offline, the ones still standing couldn’t sustain the voltage that the system needed to keep functioning. Voltage started sagging across the region. Generators saw the sagging voltage and started disconnecting themselves to avoid being damaged.

    Within seconds, the cascade of generators tripping offline created the very crisis the system was designed to avoid. The grid depended not only on real power, but on something called reactive power, an invisible supporting force that maintains voltage across the transmission system and allows electricity to actually flow. When reactive power support failed, the grid could no longer deliver electricity to customers, even though plenty of real power was still being generated.

    The cascade ran across the Northeast in about seven seconds. By the time it stopped, 265 power plants had shut down, over 500 generators had tripped offline, and 55 million people from Detroit to New York to Toronto were in the dark. It took several days to fully restore service.

    The lights went out, not because we ran out of electricity, but because we ran out of the ability to deliver it.

    What we did about it, and what we missed

    The 2003 blackout fundamentally changed how the North American grid is regulated. Before 2003, the reliability standards that grid operators followed were voluntary. After 2003, the U.S. Energy Policy Act of 2005 made those standards mandatory and enforceable, with serious financial penalties for violations. The body that writes those standards, NERC, the North American Electric Reliability Corporation, gained real teeth.

    The grid genuinely got more robust. Better monitoring. Better automated controls. Sensors called synchrophasors that measure grid state thirty times per second across thousands of locations. Operators today have visibility that operators in 2003 could not have imagined.

    We have not had another 2003-scale cascade in the Eastern Interconnection in the more than twenty years since. That’s not nothing. That’s a real achievement.

    But the regulators built that achievement to defend against a particular kind of failure. The 2003 cascade started with a tree branch and a software bug. The whole regulatory regime is oriented toward preventing transmission failures from cascading into voltage collapses.

    It is not oriented toward what happens when a brand new category of customer voluntarily disconnects from the grid in milliseconds, in coordinated waves, by design.

    The thing that already happened, that no one told you about

    On July 10, 2024, in northern Virginia, a piece of relatively routine grid equipment failed. A surge arrester, a device that protects transmission lines from voltage spikes, malfunctioned on a 230 kV line. The transmission line itself didn’t go down catastrophically. The system handled the equipment failure the way it was designed to: it briefly dipped the voltage on that line a few times in rapid succession, called a multi-shot reclose, while the line attempted to recover.

    This is the kind of event that happens dozens of times a year on the U.S. grid. Operators barely notice. The grid absorbs the disturbance and moves on.

    Except this time, sixty data centers were watching.

    The data centers detected the brief voltage dips and, doing exactly what their internal protection systems were designed to do, instantly disconnected themselves from the grid and switched over to their on-site backup power. All of them. In milliseconds. Across twenty-five different substations.

    The total load that vanished from the grid in that moment was about 1,500 megawatts. The equivalent of three large power plants suddenly going offline, except in reverse: instead of generation disappearing, customers disappeared. The grid suddenly had 1,500 megawatts of generation with nowhere to send it. Frequency started climbing. Automated controls had to scramble to dial back generation across the region before something worse happened.

    This event was not widely reported in the general press. It was the subject of a January 2025 NERC incident review that I doubt anyone outside the industry has read. But here is what NERC concluded from it: the way large data centers behave during routine grid disturbances was not anticipated by the planning studies, and current grid stability margins may not be sufficient to handle this new class of customer at the scale they are about to be deployed.

    In May of this year, NERC issued a rare Level 3 alert, the kind of alert reserved for genuinely serious grid reliability concerns, warning that uncoordinated disconnections of large computational loads pose a stability threat to the bulk power system. NERC simulations have suggested that a coordinated disconnection of 2,000 megawatts of data center load, well within the size of a single planned hyperscale campus, could destabilize 20 percent of the Eastern Interconnection. Fifty million people could lose power.

    That is the same scale of blackout as 2003. From the same kind of mechanism: a voltage disturbance, cascading. Except this time, the trigger wouldn’t be a tree branch. It would be a hyperscaler’s protection equipment doing exactly what it was designed to do.

    Where this is going

    I started this post by saying I had stopped thinking of the grid as robust infrastructure and started thinking of it as a precision-balanced machine. I want to be careful about what I mean by that. The grid is not on the edge of collapse. It works, every day, with extraordinary reliability, because of decades of engineering and regulatory effort. The bicycle stays at 10 mph.

    But the conditions the bicycle has to ride through are changing faster than the bicycle is being upgraded. The grid was built and regulated for a world where customers consumed power smoothly and predictably. We are now connecting customers, very large ones, who consume power in ways that the grid was not designed to handle, and we are doing so at a pace that grid planners cannot keep up with.

    Next Sunday, I want to write about the scale of what’s coming. Not the Virginia incident, but the buildout that’s about to dwarf it. Hyperscalers are no longer building data centers in tens of megawatts. They are building campuses in gigawatts. Plural. And they are building these campuses faster than the grid that’s supposed to serve them can be expanded.

    The result is a collision that’s just starting to play out, with implications that are going to reach all the way to your electric bill. I’ll get into it next week.


    Next Sunday: Why AI Might Not Get the Power It Needs. The collision between the AI data center boom and a grid that can’t keep up.

  • What My Electric Bill Taught Me About the Coming Grid Crisis

    What My Electric Bill Taught Me About the Coming Grid Crisis

    Part 1 of a series on what I learned by accident when I started paying attention to my electricity bill.


    It started with a dishwasher.

    Earlier this year, I switched my Ameren Missouri service over to a rate plan called Ultimate Saver. The pitch was straightforward: pay less for electricity if you can shift your usage away from peak hours. I’m not particularly frugal, but I’m curious about systems, and the structure of the plan was interesting enough that I wanted to understand it.

    What I didn’t expect was that trying to figure out when to run my dishwasher would pull me into a rabbit hole about how the entire North American power grid works, and into a slowly unfolding crisis that I think most people don’t realize is happening.

    This is the first of four posts about what I found. It starts small, with my own electric bill, and gets progressively bigger from there. By the end of the series I’ll be writing about why the AI data center boom is colliding with physical reality, and what that means for everyone who pays an electric bill.

    But first, the dishwasher.

    The plan that made me think

    Ultimate Saver has two parts that work independently of each other, which took me a while to untangle.

    The first part is time-of-use energy pricing. On weekdays, electricity costs more during two on-peak windows, 6 to 8 AM and 6 to 8 PM, and less during all the off-peak hours in between and around them. Weekends are entirely off-peak. So far, so simple: don’t run the dryer during dinner on a Tuesday.

    The second part is a demand charge. This one is weirder. Once a month, Ameren looks at every single hour of my electricity use between 6 AM and 10 PM, every day of the month, weekends included, and finds the one hour where I drew the most power. Whatever that peak hour was, in kilowatts, gets multiplied by a per-kW rate and added to my bill. One bad hour can dominate the demand charge for the entire month.

    When I first read this, I thought it was a gimmick. After spending some time with it, I think it might be one of the more honest pricing structures a utility has ever offered me.

    Here’s why. The cost of providing electricity isn’t really about how much energy you use over a month. It’s about how much capacity the grid has to maintain to serve you when you need it. A house that uses 1,000 kilowatt-hours spread evenly across a month is much cheaper to serve than a house that uses the same 1,000 kilowatt-hours but spikes hard for a few hours every evening. The first house lets the utility size its infrastructure to a steady average; the second house forces the utility to build for the peak and let that capacity sit idle most of the time.

    A demand charge takes that hidden reality and makes it visible. The price signal it sends is, basically: please don’t all hit the grid at once.

    Figuring out my own house

    Once I understood the structure, I started thinking about my own appliances. The big draws in a house like mine are the air conditioner, the electric dryer, the dishwasher (especially the heated dry cycle), the oven, and to a lesser extent things like the microwave.

    The AC was the puzzle to start with, because in summer it runs almost constantly. But here’s the thing about my thermostat: it’s set to 74°F during the day and drops to 70°F at 10 PM, when we go to bed. That means the AC’s most intense work, the pulldown from 74 to 70, happens right at 10 PM, the exact moment the demand-tracking window ends. The AC’s biggest single hour of the day falls outside the window that gets billed.

    So my real demand exposure during cooling season is the AC holding 74°F somewhere in the late afternoon, plus whatever else I happen to run on top of it. The pulldown is free.

    This made everything else simpler. If the AC’s contribution to demand is roughly fixed during the day, then the question becomes: what else am I stacking on top of it, and when?

    The dryer and the dishwasher, it turns out, are completely flexible. Nobody cares whether the dishwasher runs at 8 PM or 11 PM. Nobody cares whether the dryer finishes at 7 PM or 1 AM. These are appliances we treat as “run them whenever,” but their actual draw is significant. The dishwasher’s heated dry cycle and the dryer’s heating element are both heavy loads. Running them on top of an AC that’s already working hard in the late afternoon is exactly the kind of stacking that sets a new monthly demand peak.

    So I started running them after 10 PM. The dishwasher gets loaded throughout the evening and I just start it on my way to bed. The dryer is less convenient but still workable.

    It’s not a dramatic lifestyle change. It’s a small habit shift. But it removes both appliances from demand tracking entirely, and it captures the off-peak energy rate, which is a fraction of the on-peak rate. Two benefits for one decision.

    The question that broke the dam

    After a few weeks of this, a question started bothering me.

    Why 10 PM?

    The number is so specific. Not midnight, not 9 PM, not the time the sun sets. 10 PM, every day, weekends included. It’s the same number that ends the demand window and roughly the same time the on-peak energy pricing ends on weekdays. Ameren clearly chose it for a reason. But what reason?

    The easy answer is “that’s when people go to bed.” But that’s not really an answer. Lots of people don’t go to bed at 10 PM. And anyway, why would a utility care exactly when its individual customers go to bed? Utilities don’t bill at the individual scale; they think in aggregate.

    The real answer, I started to suspect, had to do with the grid itself.

    So I went looking.

    What I found when I looked at the actual data

    Ameren Missouri is part of a regional grid operator called MISO, the Midcontinent Independent System Operator. MISO coordinates electricity across 15 states and one Canadian province, from Minnesota down to Louisiana. They publish real-time operational data on their public website: how much electricity is being generated, where it’s coming from, how it’s flowing between regions, what the forecast looks like for tomorrow.

    I pulled their load curve for a normal weekday this spring. The shape of it is striking. Demand bottoms out around 4 AM at roughly 58,000 megawatts across the entire MISO footprint. It starts climbing around 6 AM as people wake up, grows steadily through the morning and afternoon, peaks around 6 to 7 PM at about 88,000 megawatts, and then, here’s the part that mattered to me, drops fast.

    By 8 PM, load is down 3,000 megawatts from peak. By 9 PM, it’s down 6,000. By 10 PM, it’s down 10,000. By 11 PM, it’s down 14,500 megawatts from the evening peak.

    Between 6 PM and 10 PM, the grid sheds roughly the equivalent of an entire nuclear fleet’s worth of demand. By the time the demand-charge window closes at 10 PM, the grid has genuinely entered a different operating regime. Expensive natural gas peaker plants that had to fire up to meet the evening peak can throttle back. Cheaper baseload generation, nuclear, coal, wind, handles the overnight load comfortably. The system is no longer stressed.

    That’s why 10 PM. It’s not about when I go to bed. It’s about when the grid as a whole stops needing to scramble. The number maps to physics, not to convenience.

    When I saw that, really saw it, in the actual hourly data, something shifted for me. The rate plan stopped feeling like a marketing structure and started feeling like a window into a real system. My dishwasher decision was a tiny instance of a much larger problem the grid is constantly solving.

    And the closer I looked at that larger problem, the more interesting it got. And the more concerning.

    Where this is going

    I want to tell you what I found, because I think most people have no idea how much is changing right now in the systems that quietly power their lives.

    Over the next three Sundays, I’ll be posting the rest of this series.

    Next week, I’ll write about what MISO actually does. How a continental-scale power grid manages itself in real time, what the 2003 Northeast Blackout taught us about how this can fail, and why every appliance you own is connected to a machine spanning half a continent that has to stay in perfect synchronization, every second of every day.

    The week after, I’ll get into what I now think is the most important undercovered story in the country: the collision between the AI data center boom and the physical infrastructure that has to power it. The companies building these data centers are starting to give up on the public grid entirely, with consequences that will eventually show up on your electric bill, whether you’ve heard about any of this or not.

    And in the final post, I’ll bring it back to where this started. What all of this means for someone like me, an ordinary Ameren customer running a dishwasher at 10 PM, and what we can actually do about it.

    I didn’t expect to spend this much time thinking about my electricity. But the more I understand about the system on the other side of my wall outlet, the more I think it’s one of the most important things I’ve ever paid attention to.

    The dishwasher was just the beginning.


    Next Sunday: The Grid Behind the Grid. What MISO actually does all day, and why the lights have to go out exactly as often as they do (which is more often than you think).